



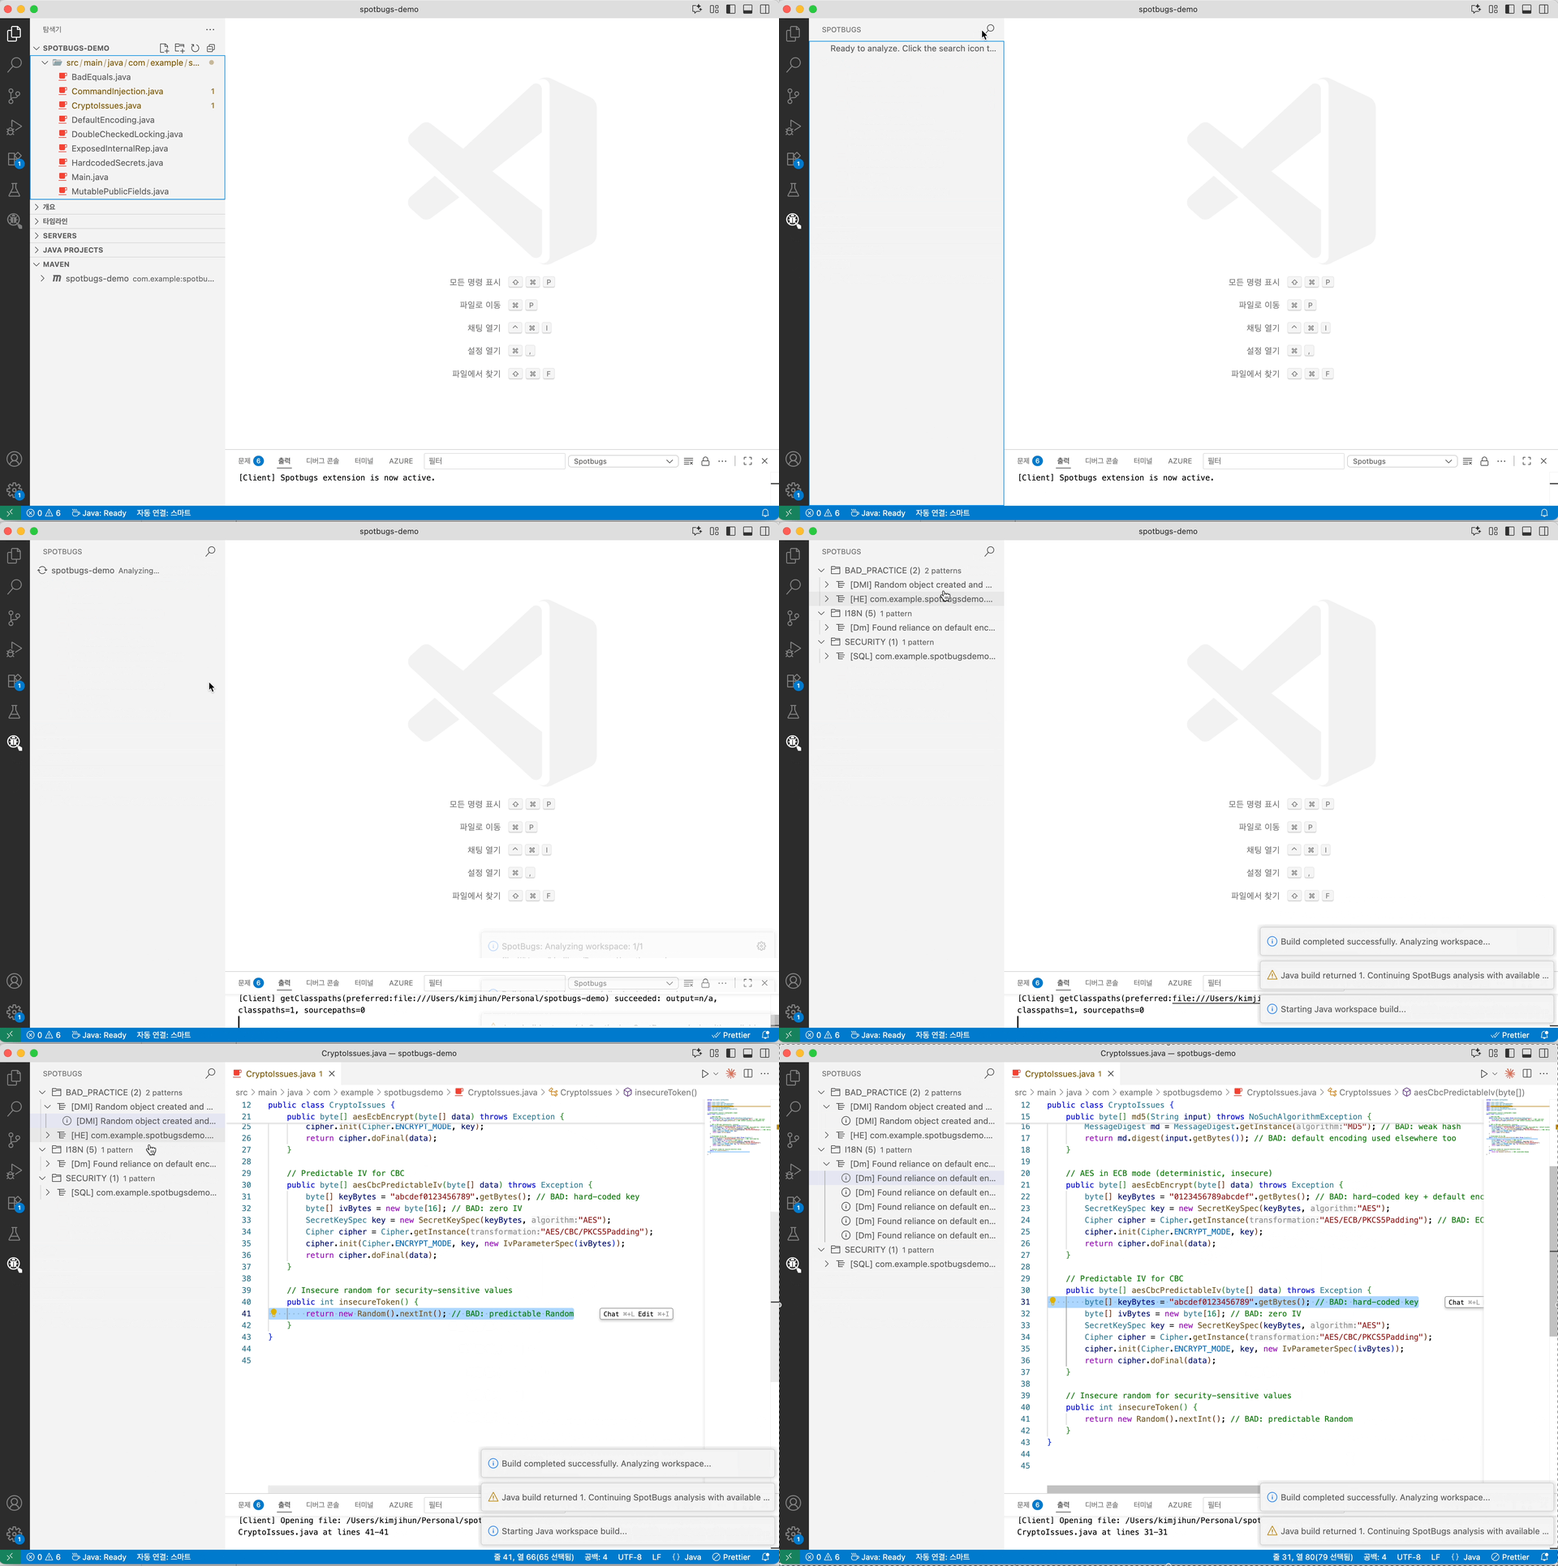
- Analyze Java sources, projects, and compiled artifacts
- Search, filter, group, and sort findings
- Read bug details and jump to the affected code
- Manage XML filters, suppressions, baselines, and SpotBugs plugins
- Export findings as SARIF or HTML
- VS Code 1.101 or later, or a compatible editor supporting VS Code API 1.101 and the Java extension
- Language Support for Java by Red Hat, installed automatically as a dependency
- A JDK for your project. See the Java extension’s JDK setup guide.
- A trusted workspace; virtual workspaces are not supported
- Install SpotBugs from the VS Code Marketplace or Open VSX.
- Open your Java project and wait for the Java extension to finish loading it.
- Save your changes and run Analyze SpotBugs Workspace from the Command Palette.
- Open SpotBugs in the Activity Bar. Select a finding to see its details and the affected code.
SpotBugs checks compiled Java classes. Workspace and project analysis build through the Java extension. For individual sources or artifacts, build your changes first.
| Command | Purpose |
|---|---|
| Analyze SpotBugs Workspace | Analyze the Java projects loaded in your workspace. |
| SpotBugs: Analyze Java Project | Analyze the current project, or choose one from the list. |
| SpotBugs: Analyze Java Sources | Analyze compiled classes for a Java source file or folder. |
| SpotBugs: Analyze Artifacts | Analyze class files, JARs, ZIPs, or bytecode directories. |
| Export SpotBugs Results (SARIF) / Export SpotBugs Results (HTML) | Export results matching the current search and filters. |
| Reset SpotBugs Results | Clear results and editor diagnostics. |
Right-click a finding or group and choose Suppress Findings... to add an XML exclusion rule.
To ignore existing findings in future runs, use SpotBugs: Create Baseline from Current Workspace Results... after a successful, complete workspace analysis. This includes all findings, even those hidden by view filters. Both suppression and baseline creation require a single-folder workspace.
Open SpotBugs: Open Settings for all options. Analysis settings take effect on the next run.
| Setting | Default | Purpose |
|---|---|---|
spotbugs.analysis.effort |
default |
Analysis effort: min, less, default, or max. |
spotbugs.analysis.minimumConfidence |
default |
Minimum confidence: high, medium, or low. Default settings report all three confidence levels. |
spotbugs.analysis.priorityThreshold |
9 |
Maximum rank to report: 1 is most severe, 20 least severe. |
spotbugs.analysis.extraAuxClasspaths |
[] |
Additional dependency JARs or directories. |
Use the Filters and Plugins views to add or remove files, or configure paths directly:
spotbugs.filters.includePaths: XML include filtersspotbugs.filters.excludePaths: XML exclude filtersspotbugs.filters.excludeBaselineBugsPaths: XML baseline bug collectionsspotbugs.plugins.registrations: SpotBugs plugin JAR registrations
Paths can be absolute or workspace-relative. Right-click a plugin to enable or disable it for the next analysis. Each registration has a stable ID and owns its path, enabled state, and detector overrides:
"spotbugs.plugins.registrations": [
  {
    "id": "findsecbugs-main",
    "path": "plugins/findsecbugs.jar",
    "enabled": true,
    "detectors": {
      "com.h3xstream.findsecbugs.PredictableRandomDetector": false
    }
  }
]
Adding a JAR generates an ID automatically. Keep the ID when editing the path or detector settings; use a new ID when adding a separate registration manually. IDs must be nonempty and unique within each settings scope. Commands target the saved ID, so reordering or deleting another row does not change their target. Removing and re-adding a JAR creates a new registration.
Right-click SpotBugs Core or a plugin and choose Configure Detectors. Search by detector class or reported rule, then choose Default, Enabled, or Disabled. Core overrides are stored in spotbugs.analysis.detectors; plugin overrides stay inside their registration. Default removes the override. Disabling a plugin preserves its overrides without loading the JAR. Changing its path preserves them; removing the registration removes them.
An explicit Workspace registration list or core detector object replaces the corresponding User value, including [] and {}. Removing the Workspace setting restores inheritance. Changes apply to the next analysis; a running analysis uses its original settings snapshot.
The inventory uses the same runtime loader as analysis and lists actual detectors. It inspects each active registration once, displays failures on the affected rows, and keeps Core and successfully loaded plugin settings available. Analysis still fails for unknown active overrides, duplicate active JARs or plugin IDs, and overrides affected by SpotBugs short-name collisions. Configured detector names remain selectable for correction when unresolved. Detector switches are SpotBugs preferences: dependency, effort, and JRE rules still apply.
The old spotbugs.plugins.paths and spotbugs.plugins.disabledPaths settings are ignored. After updating, re-add custom JARs in the Plugins view or configure spotbugs.plugins.registrations directly, then restore any disabled states. Old values are left untouched; custom plugins will not run until registered in the new setting.
Changes in one window are saved in order. Concurrent edits from separate windows retain VS Code's usual last-write behavior.
Set spotbugs.results.revealSourceOnSelection to false to turn off automatic source preview.
Use spotbugs.diagnostics.severity.* to change how findings appear in the editor and Problems view:
| Setting suffix | Rank | Default |
|---|---|---|
scariest |
1–4 | error |
scary |
5–9 | warning |
troubling |
10–14 | information |
ofConcern |
15–20 | information |
Choose error, warning, or information. Changes apply immediately and can be set per workspace folder.
Check Output → SpotBugs for analysis logs and missing class names. Make sure your Java project is loaded and builds successfully. Add missing dependencies to your project or use spotbugs.analysis.extraAuxClasspaths.
Analysis runs locally in your workspace. This extension does not upload your code or findings, and does not currently send telemetry. Your editor and Java extension have separate telemetry settings.
Rule documentation links open in your browser. SARIF reports can include local file paths, so check them before sharing.
Report bugs and suggest improvements in GitHub Issues. See CONTRIBUTING.md for development setup and CHANGELOG.md for release notes.
The extension is MIT-licensed. SpotBugs is licensed under LGPL 2.1. See THIRD_PARTY_NOTICES.md for third-party licenses.