
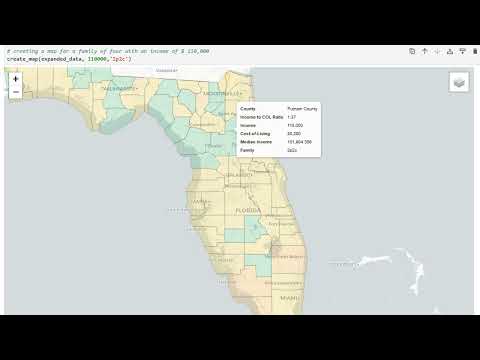
This interactive map helps users explore the affordability of Florida counties based on household income and cost of living data.
Choosing a place to live can feel overwhelming. This project simplifies that decision by providing a visual tool that compares household income to the cost of living in each Florida county. Users can quickly see where they can afford to live, based on income and household size.
You can click the image here to get a 45-second summary on YouTube
To run this project, you will need Python and the following libraries:
- Python
- pandas
- geopandas
- folium
- numpy
- openpyxl
- Jupyter Notebook
Place the data folder at the project root. The notebook expects data/florida_counties.geojson and data/fbc_data_2024.xlsx.
Likewise, click the badge here to launch an interactive version in your browser:

- Launch the notebook via Binder or clone the repo locally.
- Open the Jupyter Notebook.
- Adjust the income and household size inputs to view affordability.
- View color-coded county maps and output summaries.
- 📊 Visualize affordability across Florida's counties.
- 👨👩👧 Household-size specific cost of living comparisons.
- 💵 Adjusts for income levels from $0 to $200,000.
- 🧮 Includes affordability ratios and surplus/deficit values.

- How to clean and merge multiple datasets.
- Building geographic visualizations using GeoPandas.
- Turning abstract questions into data-driven tools.
- Expand beyond Florida to other U.S. states.
- Include public transportation and quality-of-life factors.
- Deploy a web version (e.g., Streamlit or Dash).
Hi, I’m Mark! I enjoy simplifying complex decisions using data. If you're interested in this work or want to collaborate, feel free to connect.
- LinkedIn: www.linkedin.com/in/mark-izevbigie
- Email: markizevbigie@gmail.com