Skip to content

[Perf] Windows/x64: 19 Regressions on 10/2/2026 3:37:56 PM +00:00 #135285

Closed

Description

@performanceautofiler

Run Information

Name Value
Architecture x64
OS Windows 10.0.22631
Queue ViperWindows
Baseline ffc818ff8b4c7cca64d3c148831501ad42e23acf
Compare b60e14acce3bf6e079f7cacfc541318b3217ff73
Diff Diff
Configs CompilationMode:tiered, RunKind:micro

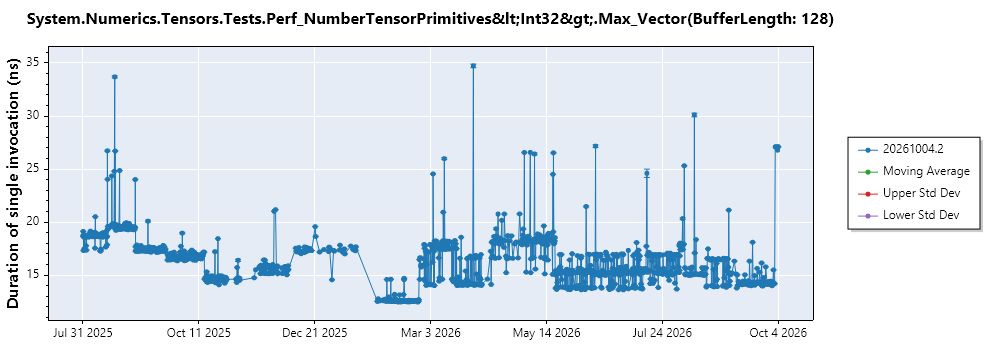
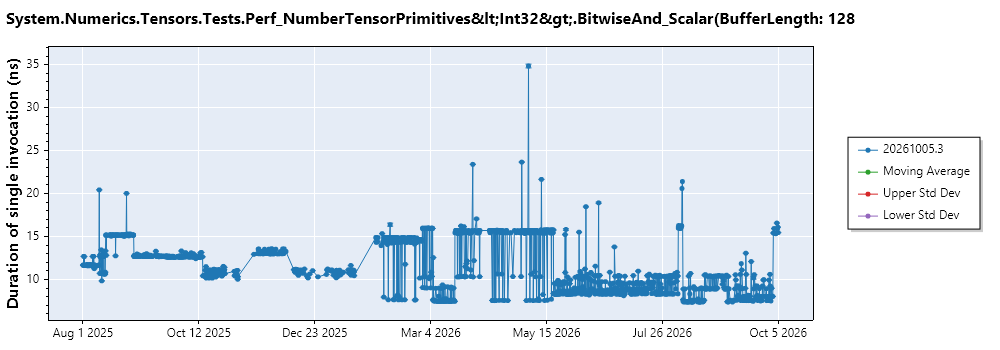
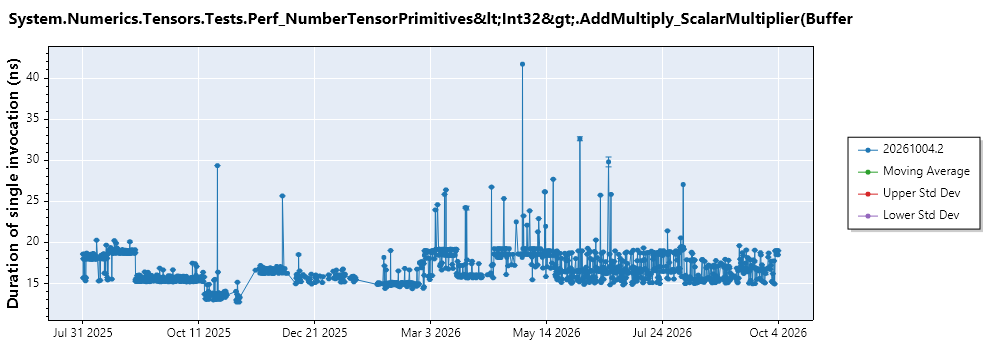
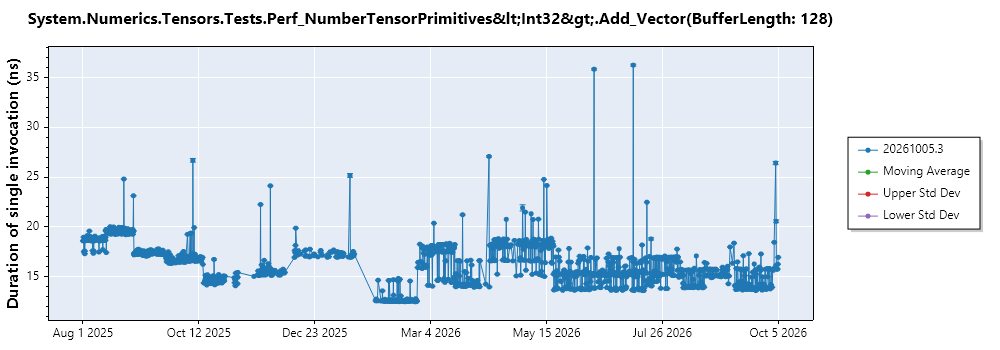
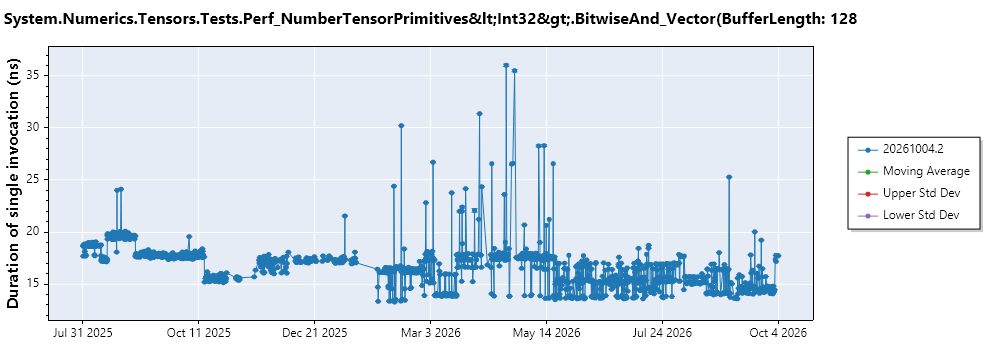
Regressions in System.Numerics.Tensors.Tests.Perf_NumberTensorPrimitives<Int32>

Benchmark Baseline Test Test/Base Test Quality Edge Detector Baseline IR Compare IR IR Ratio
15.78 ns 27.09 ns 1.72 0.41 False
9.98 ns 15.45 ns 1.55 0.59 False
16.22 ns 19.00 ns 1.17 0.51 False
14.25 ns 15.75 ns 1.10 0.51 False
15.72 ns 17.23 ns 1.10 0.45 False

graph
graph
graph
graph
graph
Test Report

Repro

General Docs link: https://github.com/dotnet/performance/blob/main/docs/benchmarking-workflow-dotnet-runtime.md

git clone https://github.com/dotnet/performance.git
py .\performance\scripts\benchmarks_ci.py -f net8.0 --filter 'System.Numerics.Tensors.Tests.Perf_NumberTensorPrimitives<Int32>*'
Details

System.Numerics.Tensors.Tests.Perf_NumberTensorPrimitives<Int32>.Max_Vector(BufferLength: 128)

ETL Files

Histogram

JIT Disasms

System.Numerics.Tensors.Tests.Perf_NumberTensorPrimitives<Int32>.BitwiseAnd_Scalar(BufferLength: 128)

ETL Files

Histogram

JIT Disasms

System.Numerics.Tensors.Tests.Perf_NumberTensorPrimitives<Int32>.AddMultiply_ScalarMultiplier(BufferLength: 128)

ETL Files

Histogram

JIT Disasms

System.Numerics.Tensors.Tests.Perf_NumberTensorPrimitives<Int32>.Add_Vector(BufferLength: 128)

ETL Files

Histogram

JIT Disasms

System.Numerics.Tensors.Tests.Perf_NumberTensorPrimitives<Int32>.BitwiseAnd_Vector(BufferLength: 128)

ETL Files

Histogram

JIT Disasms

Docs

Profiling workflow for dotnet/runtime repository
Benchmarking workflow for dotnet/runtime repository


Run Information

Name Value
Architecture x64
OS Windows 10.0.22631
Queue ViperWindows
Baseline ffc818ff8b4c7cca64d3c148831501ad42e23acf
Compare b60e14acce3bf6e079f7cacfc541318b3217ff73
Diff Diff
Configs CompilationMode:tiered, RunKind:micro

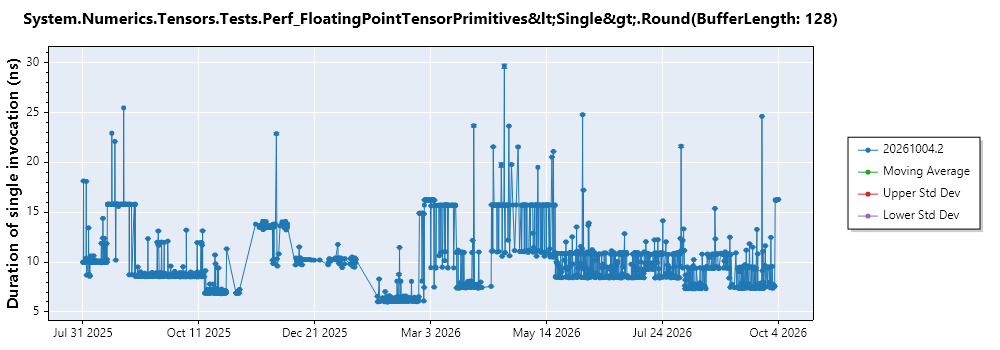
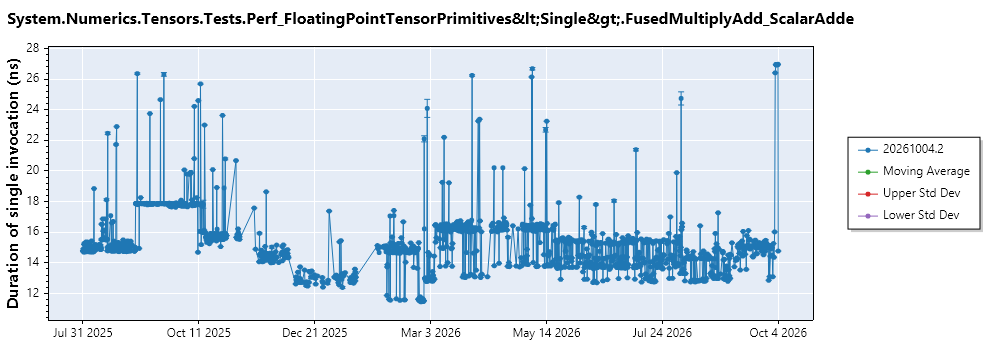
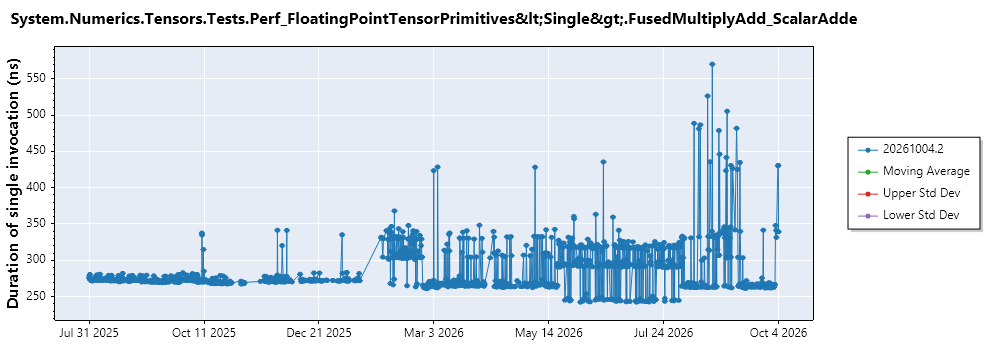
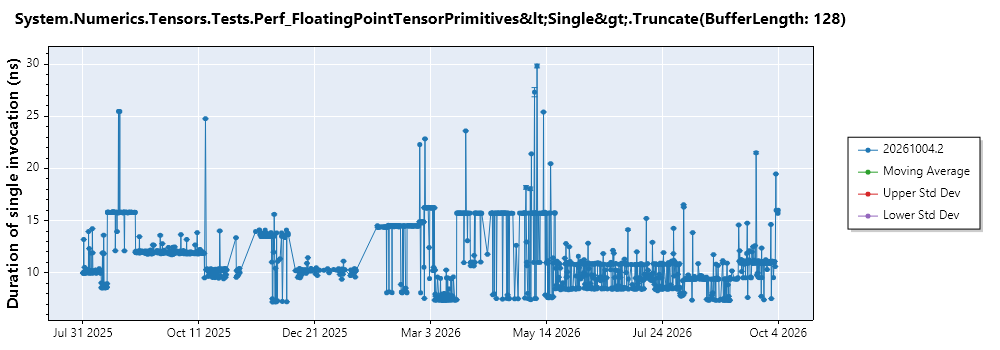
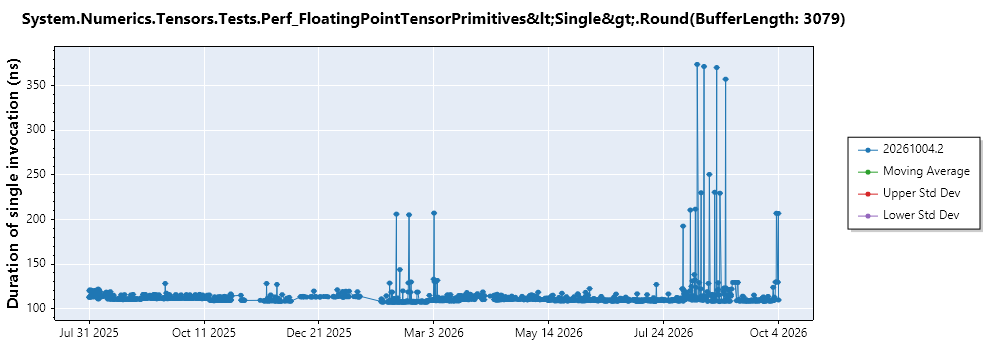
Regressions in System.Numerics.Tensors.Tests.Perf_FloatingPointTensorPrimitives<Single>

Benchmark Baseline Test Test/Base Test Quality Edge Detector Baseline IR Compare IR IR Ratio
7.55 ns 16.28 ns 2.16 0.62 False
15.47 ns 26.97 ns 1.74 0.47 False
263.93 ns 422.61 ns 1.60 0.48 False
11.25 ns 15.72 ns 1.40 0.51 False
111.78 ns 138.13 ns 1.24 0.23 False

graph
graph
graph
graph
graph
Test Report

Repro

General Docs link: https://github.com/dotnet/performance/blob/main/docs/benchmarking-workflow-dotnet-runtime.md

git clone https://github.com/dotnet/performance.git
py .\performance\scripts\benchmarks_ci.py -f net8.0 --filter 'System.Numerics.Tensors.Tests.Perf_FloatingPointTensorPrimitives<Single>*'
Details

System.Numerics.Tensors.Tests.Perf_FloatingPointTensorPrimitives<Single>.Round(BufferLength: 128)

ETL Files

Histogram

JIT Disasms

System.Numerics.Tensors.Tests.Perf_FloatingPointTensorPrimitives<Single>.FusedMultiplyAdd_ScalarAddend(BufferLength: 128)

ETL Files

Histogram

JIT Disasms

System.Numerics.Tensors.Tests.Perf_FloatingPointTensorPrimitives<Single>.FusedMultiplyAdd_ScalarAddend(BufferLength: 3079)

ETL Files

Histogram

JIT Disasms

System.Numerics.Tensors.Tests.Perf_FloatingPointTensorPrimitives<Single>.Truncate(BufferLength: 128)

ETL Files

Histogram

JIT Disasms

System.Numerics.Tensors.Tests.Perf_FloatingPointTensorPrimitives<Single>.Round(BufferLength: 3079)

ETL Files

Histogram

JIT Disasms

Docs

Profiling workflow for dotnet/runtime repository
Benchmarking workflow for dotnet/runtime repository


Run Information

Name Value
Architecture x64
OS Windows 10.0.22631
Queue ViperWindows
Baseline ffc818ff8b4c7cca64d3c148831501ad42e23acf
Compare b60e14acce3bf6e079f7cacfc541318b3217ff73
Diff Diff
Configs CompilationMode:tiered, RunKind:micro

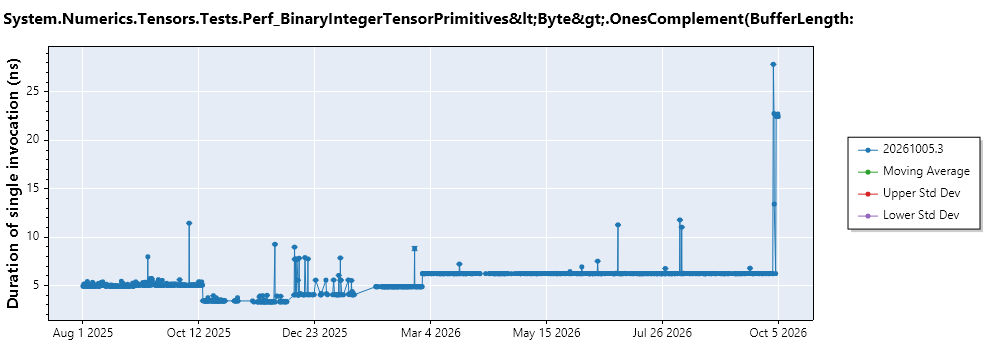
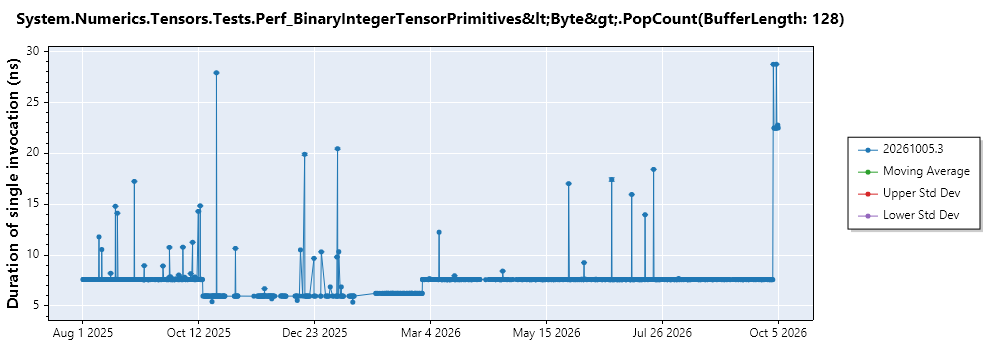
Regressions in System.Numerics.Tensors.Tests.Perf_BinaryIntegerTensorPrimitives<Byte>

Benchmark Baseline Test Test/Base Test Quality Edge Detector Baseline IR Compare IR IR Ratio
6.23 ns 22.45 ns 3.60 0.04 False
7.57 ns 22.49 ns 2.97 0.03 False

graph
graph
Test Report

Repro

General Docs link: https://github.com/dotnet/performance/blob/main/docs/benchmarking-workflow-dotnet-runtime.md

git clone https://github.com/dotnet/performance.git
py .\performance\scripts\benchmarks_ci.py -f net8.0 --filter 'System.Numerics.Tensors.Tests.Perf_BinaryIntegerTensorPrimitives<Byte>*'
Details

System.Numerics.Tensors.Tests.Perf_BinaryIntegerTensorPrimitives<Byte>.OnesComplement(BufferLength: 128)

ETL Files

Histogram

JIT Disasms

System.Numerics.Tensors.Tests.Perf_BinaryIntegerTensorPrimitives<Byte>.PopCount(BufferLength: 128)

ETL Files

Histogram

JIT Disasms

Docs

Profiling workflow for dotnet/runtime repository
Benchmarking workflow for dotnet/runtime repository


Run Information

Name Value
Architecture x64
OS Windows 10.0.22631
Queue ViperWindows
Baseline ffc818ff8b4c7cca64d3c148831501ad42e23acf
Compare b60e14acce3bf6e079f7cacfc541318b3217ff73
Diff Diff
Configs CompilationMode:tiered, RunKind:micro

Regressions in System.Numerics.Tensors.Tests.Perf_NumberTensorPrimitives<Single>

Benchmark Baseline Test Test/Base Test Quality Edge Detector Baseline IR Compare IR IR Ratio
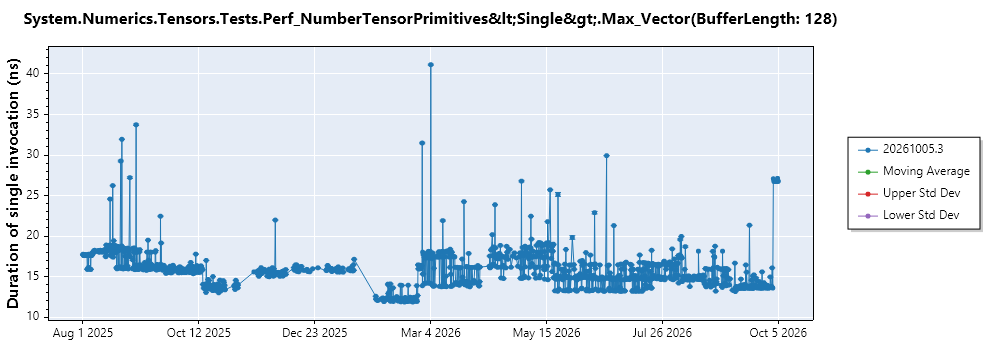
14.26 ns 27.11 ns 1.90 0.48 False
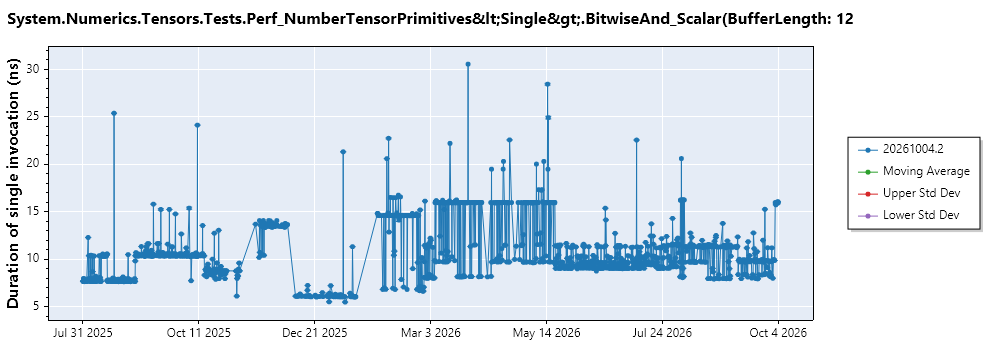
9.90 ns 15.99 ns 1.62 0.60 False

graph
graph
Test Report

Repro

General Docs link: https://github.com/dotnet/performance/blob/main/docs/benchmarking-workflow-dotnet-runtime.md

git clone https://github.com/dotnet/performance.git
py .\performance\scripts\benchmarks_ci.py -f net8.0 --filter 'System.Numerics.Tensors.Tests.Perf_NumberTensorPrimitives<Single>*'
Details

System.Numerics.Tensors.Tests.Perf_NumberTensorPrimitives<Single>.Max_Vector(BufferLength: 128)

ETL Files

Histogram

JIT Disasms

System.Numerics.Tensors.Tests.Perf_NumberTensorPrimitives<Single>.BitwiseAnd_Scalar(BufferLength: 128)

ETL Files

Histogram

JIT Disasms

Docs

Profiling workflow for dotnet/runtime repository
Benchmarking workflow for dotnet/runtime repository


Run Information

Name Value
Architecture x64
OS Windows 10.0.22631
Queue ViperWindows
Baseline ffc818ff8b4c7cca64d3c148831501ad42e23acf
Compare b60e14acce3bf6e079f7cacfc541318b3217ff73
Diff Diff
Configs CompilationMode:tiered, RunKind:micro

Regressions in System.Collections.Tests.Perf_BitArray

Benchmark Baseline Test Test/Base Test Quality Edge Detector Baseline IR Compare IR IR Ratio
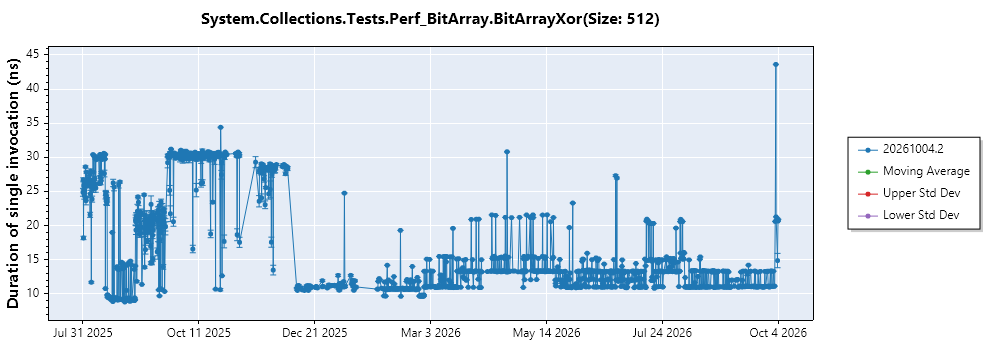
11.07 ns 20.92 ns 1.89 0.52 False
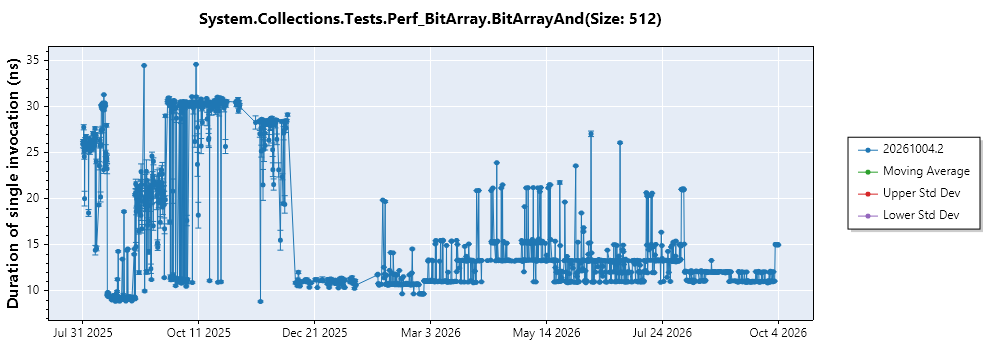
11.02 ns 14.98 ns 1.36 0.40 False

graph
graph
Test Report

Repro

General Docs link: https://github.com/dotnet/performance/blob/main/docs/benchmarking-workflow-dotnet-runtime.md

git clone https://github.com/dotnet/performance.git
py .\performance\scripts\benchmarks_ci.py -f net8.0 --filter 'System.Collections.Tests.Perf_BitArray*'
Details

System.Collections.Tests.Perf_BitArray.BitArrayXor(Size: 512)

ETL Files

Histogram

JIT Disasms

System.Collections.Tests.Perf_BitArray.BitArrayAnd(Size: 512)

ETL Files

Histogram

JIT Disasms

Docs

Profiling workflow for dotnet/runtime repository
Benchmarking workflow for dotnet/runtime repository


Run Information

Name Value
Architecture x64
OS Windows 10.0.22631
Queue ViperWindows
Baseline ffc818ff8b4c7cca64d3c148831501ad42e23acf
Compare b60e14acce3bf6e079f7cacfc541318b3217ff73
Diff Diff
Configs CompilationMode:tiered, RunKind:micro

Regressions in System.Text.Perf_Ascii

Benchmark Baseline Test Test/Base Test Quality Edge Detector Baseline IR Compare IR IR Ratio
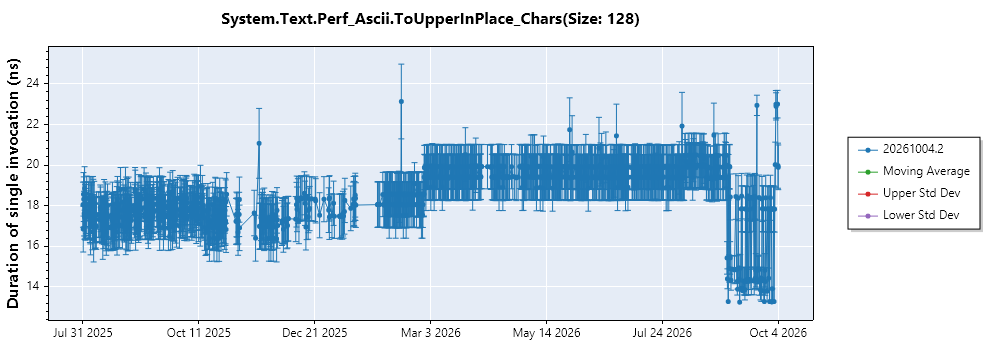
18.39 ns 23.49 ns 1.28 0.21 False
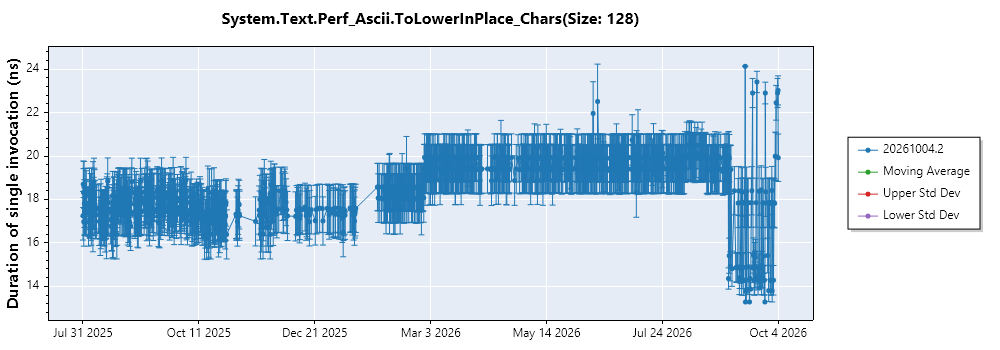
18.35 ns 23.02 ns 1.25 0.17 False

graph
graph
Test Report

Repro

General Docs link: https://github.com/dotnet/performance/blob/main/docs/benchmarking-workflow-dotnet-runtime.md

git clone https://github.com/dotnet/performance.git
py .\performance\scripts\benchmarks_ci.py -f net8.0 --filter 'System.Text.Perf_Ascii*'
Details

System.Text.Perf_Ascii.ToUpperInPlace_Chars(Size: 128)

ETL Files

Histogram

JIT Disasms

System.Text.Perf_Ascii.ToLowerInPlace_Chars(Size: 128)

ETL Files

Histogram

JIT Disasms

Docs

Profiling workflow for dotnet/runtime repository
Benchmarking workflow for dotnet/runtime repository


Run Information

Name Value
Architecture x64
OS Windows 10.0.22631
Queue ViperWindows
Baseline ffc818ff8b4c7cca64d3c148831501ad42e23acf
Compare b60e14acce3bf6e079f7cacfc541318b3217ff73
Diff Diff
Configs CompilationMode:tiered, RunKind:micro

Regressions in System.Memory.Span<Int32>

Benchmark Baseline Test Test/Base Test Quality Edge Detector Baseline IR Compare IR IR Ratio
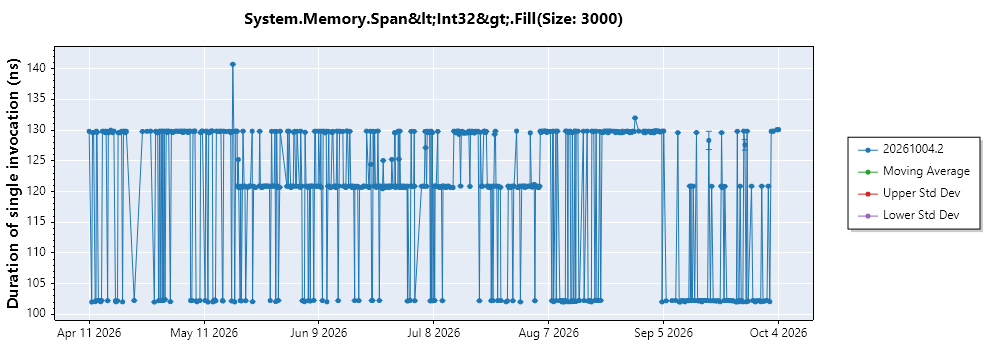
102.14 ns 129.82 ns 1.27 0.33 False

graph
Test Report

Repro

General Docs link: https://github.com/dotnet/performance/blob/main/docs/benchmarking-workflow-dotnet-runtime.md

git clone https://github.com/dotnet/performance.git
py .\performance\scripts\benchmarks_ci.py -f net8.0 --filter 'System.Memory.Span<Int32>*'
Details

System.Memory.Span<Int32>.Fill(Size: 3000)

ETL Files

Histogram

JIT Disasms

Docs

Profiling workflow for dotnet/runtime repository
Benchmarking workflow for dotnet/runtime repository

Activity

  1. LoopedBard3 commented on Oct 6, 2026

    @LoopedBard3
    Member

    🔍 Automated Triage Analysis

    Summary: Measured regression in 2 test(s). Bisection localized commit boundaries, but a related functional cause has not been established. Uncertain or unrelated code-path relevance does not establish that the measured change is noise. Bisection found no change for 2 test(s) — it ran but the change didn't reproduce (noisy or bimodal pattern).

    Finding Confidence: 4/5 (analysis accuracy)
    Regression Confidence: 4/5 (likelihood of true regression)

    🤖 Proposed Next Actions: Uncertain — flag for re-triage — 1 done, 1 dry-run (rule R5_look_again — see Full Analysis for the table).

    📊 Full Analysis (click to expand)

    Summary: Historical analysis confirms 13 regressions (+25.49% to +260.14%), with four additional borderline slowdowns and two noise-level changes. The leading shared cause is 7693364, a CoreCLR JIT loop-unrolling change; finding confidence is 4/5 and regression confidence is 4/5 for the strongest signals, but attribution remains unverified because a targeted Helix run completed without a report.

    Issue Overview

    • Issue: #80370 - [Perf] Windows/x64: 19 Regressions on 10/2/2026 3:37:56 PM +00:00
    • Date: 2026-10-02 | Queue: Windows.11.Amd64.Viper.Perf | OS/Arch: Windows 10.0.22631/x64
    • Commits: ffc818f → b60e14a (28 commits)
    • Labels: untriaged, perf-regression, os-windows, arch-x64, branch-refs/heads/main, runtime-coreclr, kind-micro, compilationmode-tiered, runkind-micro
    • Runtime stack: Desktop + CoreCLR
    • Description: The weekly Windows/x64 tiered microbenchmark run reported 19 slowdowns across TensorPrimitives, BitArray, ASCII casing, and Span.Fill.
    • Historical Data: Available (1,247 measurement points examined; 296-300 historical measurements per test, including 13 post-change measurements)

    Test Analysis

    Test Name Baseline Compare Δ% μ σ n z Thresh% Noise? Assessment
    NumberTensorPrimitives<Int32>.Max_Vector(128) 15.777 27.094 +71.73% 15.525 1.673 300 6.915 21.55% N Regression; step change
    NumberTensorPrimitives<Int32>.BitwiseAnd_Scalar(128) 9.975 15.453 +54.92% 9.275 2.063 299 2.995 44.49% N Regression; step change, high variance
    NumberTensorPrimitives<Int32>.AddMultiply_ScalarMultiplier(128) 16.216 19.001 +17.18% 16.875 1.440 299 1.476 17.07% N Borderline; narrowly above threshold
    NumberTensorPrimitives<Int32>.Add_Vector(128) 14.251 15.747 +10.50% 15.218 1.145 296 0.462 15.05% Y Within variance
    NumberTensorPrimitives<Int32>.BitwiseAnd_Vector(128) 15.722 17.227 +9.57% 15.465 1.312 300 1.343 16.97% Y Within variance
    FloatingPointTensorPrimitives<Single>.Round(128) 7.546 16.277 +115.71% 9.438 1.855 299 3.687 39.31% N Regression; step change
    FloatingPointTensorPrimitives<Single>.FusedMultiplyAdd_ScalarAddend(128) 15.470 26.973 +74.36% 14.385 1.161 298 10.842 16.14% N Regression; strong step change
    FloatingPointTensorPrimitives<Single>.FusedMultiplyAdd_ScalarAddend(3079) 263.934 422.606 +60.12% 294.572 50.615 299 2.530 34.37% N Regression; step change, high variance
    FloatingPointTensorPrimitives<Single>.Truncate(128) 11.251 15.718 +39.70% 9.854 1.631 300 3.595 33.10% N Regression; step change
    FloatingPointTensorPrimitives<Single>.Round(3079) 111.784 138.134 +23.57% 117.806 34.343 296 0.592 58.30% N Borderline; mixed post-change series
    BinaryIntegerTensorPrimitives<Byte>.OnesComplement(128) 6.233 22.449 +260.14% 6.268 0.426 298 37.984 13.59% N Regression; extreme step change
    BinaryIntegerTensorPrimitives<Byte>.PopCount(128) 7.573 22.488 +196.95% 7.642 0.727 298 20.421 19.03% N Regression; extreme step change
    NumberTensorPrimitives<Single>.Max_Vector(128) 14.261 27.115 +90.13% 15.019 1.341 299 9.020 17.86% N Regression; sustained step change
    NumberTensorPrimitives<Single>.BitwiseAnd_Scalar(128) 9.896 15.987 +61.55% 10.405 1.694 299 3.295 32.56% N Regression; step change, high variance
    BitArray.BitArrayXor(512) 11.067 20.921 +89.04% 12.795 2.290 298 3.548 35.80% N Regression; step change, variable tail
    BitArray.BitArrayAnd(512) 11.021 14.976 +35.88% 12.605 2.196 299 1.079 34.84% N Borderline; weak z-score
    Ascii.ToUpperInPlace_Chars(128) 18.392 23.488 +27.71% 18.532 2.196 300 2.257 23.70% N Regression; drift
    Ascii.ToLowerInPlace_Chars(128) 18.347 23.024 +25.49% 18.660 2.088 299 2.090 22.38% N Regression; drift
    Span<Int32>.Fill(3000) 102.142 129.821 +27.10% 118.351 12.315 298 0.931 20.81% N Borderline; multimodal history and drift

    Legend: μ=mean, σ=stddev, n=historical measurements, z=z-score, Thresh%=adaptive threshold

    Finding Confidence: 4/5 - Every test has 296-300 historical measurements and the strongest regressions are sustained across 13 post-change measurements. Confidence is not 5/5 because the targeted verification job returned no benchmark report.

    Candidate Stack Relevance

    Commit Touched Paths (summary) Relevance Notes
    7693364 src/coreclr/jit/flowgraph.cpp, optimizer.cpp Relevant Stops recognizing loop tests evaluated into temporaries, causing affected loops to miss JIT unrolling; this is the best shared mechanism across all four benchmark areas.
    779bd79 src/coreclr/jit/assertionprop.cpp Relevant Large assertion-propagation rewrite could alter generated code broadly, but has a less direct connection to the short loop-heavy benchmarks.
    d6299e4 src/coreclr/jit/ Relevant Removes dead flags and is documented as producing no assembly differences, making it an unlikely cause.
    be7b579 src/libraries/System.Numerics.Tensors/ Shared Tensor-specific and therefore plausible only for part of the report; changed shape/traversal code does not explain BitArray, ASCII, or Span regressions.
    b60e14a eng/pipelines/ Shared Seeds Debug Roslyn caches and does not change product binaries or benchmark execution.

    Confirmed Regressions

    BinaryIntegerTensorPrimitives<Byte>.OnesComplement(BufferLength: 128) (+260.14%)

    • Delta: 6.233 ns → 22.449 ns (+260.14%)
    • Historical Context: μ=6.268 ns (σ=0.426, n=298); z-score=37.984; adaptive threshold=13.59%
    • Assessment: Extreme, sustained step change
    • Finding Confidence: 4/5 - Comprehensive history and an extreme outlier, but no usable verification report
    • Regression Confidence: 4/5 - Very strong signal and a focused shared JIT candidate; capped because attribution is not isolated
    • Likely Cause: 7693364 - "JIT: Skip unrolling tests stored in locals"
      • Affected Areas: JIT loop optimization, TensorPrimitives
      • Stack Relevance: Relevant
      • Rationale: The change removes recognition of loop tests evaluated into temporaries, so affected small loops no longer qualify for unrolling. That mechanism fits the abrupt degradation in short, loop-heavy TensorPrimitives operations and also explains the unrelated library regressions.
      • Candidates Considered:
        • 779bd79 - broad JIT assertion-propagation change, but no specific unrolling mechanism
        • be7b579 - tensor-specific, but does not explain the correlated non-tensor tests
    • Verification Status: Not verified; a four-build Helix job completed without producing a benchmark report

    BinaryIntegerTensorPrimitives<Byte>.PopCount(BufferLength: 128) (+196.95%)

    • Delta: 7.573 ns → 22.488 ns (+196.95%)
    • Historical Context: μ=7.642 ns (σ=0.727, n=298); z-score=20.421; adaptive threshold=19.03%
    • Assessment: Extreme, sustained step change
    • Finding Confidence: 4/5 - Comprehensive history and an extreme outlier
    • Regression Confidence: 4/5 - Strong shared JIT mechanism, pending isolation
    • Likely Cause: 7693364 - "JIT: Skip unrolling tests stored in locals"
      • Affected Areas: JIT loop optimization, TensorPrimitives
      • Stack Relevance: Relevant
      • Rationale: Missing unrolling can disproportionately affect the tiny loop body used at buffer length 128. Its timing and close correlation with OnesComplement support the same JIT-level cause.
      • Candidates Considered:
        • 779bd79 - broad JIT candidate with weaker code-path specificity
        • be7b579 - tensor-only candidate
    • Verification Status: Not verified; targeted Helix run produced no report

    FloatingPointTensorPrimitives<Single>.Round(BufferLength: 128) (+115.71%)

    • Delta: 7.546 ns → 16.277 ns (+115.71%)
    • Historical Context: μ=9.438 ns (σ=1.855, n=299); z-score=3.687; adaptive threshold=39.31%
    • Assessment: Step change despite elevated variance
    • Finding Confidence: 4/5 - Long history and significant z-score
    • Regression Confidence: 4/5 - Strong signal with a direct JIT-loop mechanism
    • Likely Cause: 7693364 - "JIT: Skip unrolling tests stored in locals"
      • Affected Areas: JIT loop optimization, TensorPrimitives
      • Stack Relevance: Relevant
      • Rationale: The short vectorized traversal is sensitive to loop optimization, and the slowdown begins in the same window as stronger TensorPrimitives outliers. The candidate also accounts for non-tensor co-movement.
      • Candidates Considered:
        • 779bd79 - alternate broad JIT candidate
        • be7b579 - tensor candidate without cross-library coverage
    • Verification Status: Not verified; targeted Helix run produced no report

    NumberTensorPrimitives<Single>.Max_Vector(BufferLength: 128) (+90.13%)

    • Delta: 14.261 ns → 27.115 ns (+90.13%)
    • Historical Context: μ=15.019 ns (σ=1.341, n=299); z-score=9.020; adaptive threshold=17.86%
    • Assessment: Sustained step change
    • Finding Confidence: 4/5 - Strong historical separation
    • Regression Confidence: 4/5 - Strong signal and matching loop-optimization mechanism
    • Likely Cause: 7693364 - "JIT: Skip unrolling tests stored in locals"
      • Affected Areas: JIT loop optimization, TensorPrimitives
      • Stack Relevance: Relevant
      • Rationale: Max_Vector directly exercises a short TensorPrimitives traversal, where loss of unrolling increases loop-control overhead. The matching Int32 result and unrelated BitArray regression favor a JIT cause over a type-specific library change.
      • Candidates Considered:
    • Verification Status: Not verified; targeted Helix run produced no report

    BitArray.BitArrayXor(Size: 512) (+89.04%)

    • Delta: 11.067 ns → 20.921 ns (+89.04%)
    • Historical Context: μ=12.795 ns (σ=2.290, n=298); z-score=3.548; adaptive threshold=35.80%
    • Assessment: Step change with a variable post-change tail
    • Finding Confidence: 4/5 - Large delta and significant z-score over extensive history
    • Regression Confidence: 4/5 - Corroborates a shared JIT regression rather than a tensor-only change
    • Likely Cause: 7693364 - "JIT: Skip unrolling tests stored in locals"
      • Affected Areas: JIT loop optimization, Collections
      • Stack Relevance: Relevant
      • Rationale: BitArray.Xor is loop-heavy and has no directly relevant library commit in the range. A loss of JIT loop unrolling provides a concrete shared explanation for this regression and the simultaneous TensorPrimitives changes.
      • Candidates Considered:
        • 779bd79 - broad JIT candidate, less specific to loops
        • d6299e4 - JIT cleanup expected to have no assembly diffs
    • Verification Status: Not verified; this representative test was submitted to Helix but no report was returned

    FloatingPointTensorPrimitives<Single>.FusedMultiplyAdd_ScalarAddend(BufferLength: 128) (+74.36%)

    • Delta: 15.470 ns → 26.973 ns (+74.36%)
    • Historical Context: μ=14.385 ns (σ=1.161, n=298); z-score=10.842; adaptive threshold=16.14%
    • Assessment: Strong step change
    • Finding Confidence: 4/5 - Strong separation over comprehensive history
    • Regression Confidence: 4/5 - Direct loop mechanism and correlated tests
    • Likely Cause: 7693364 - "JIT: Skip unrolling tests stored in locals"
      • Affected Areas: JIT loop optimization, TensorPrimitives
      • Stack Relevance: Relevant
      • Rationale: The small-buffer variant is especially exposed to per-iteration control overhead. Its z-score and synchronization with several short-loop regressions strongly support the JIT unrolling candidate.
      • Candidates Considered:
    • Verification Status: Not verified; targeted Helix run produced no report

    NumberTensorPrimitives<Int32>.Max_Vector(BufferLength: 128) (+71.73%)

    • Delta: 15.777 ns → 27.094 ns (+71.73%)
    • Historical Context: μ=15.525 ns (σ=1.673, n=300); z-score=6.915; adaptive threshold=21.55%
    • Assessment: Strong step change
    • Finding Confidence: 4/5 - Extensive history and significant outlier
    • Regression Confidence: 4/5 - Matching Single result and shared JIT mechanism
    • Likely Cause: 7693364 - "JIT: Skip unrolling tests stored in locals"
      • Affected Areas: JIT loop optimization, TensorPrimitives
      • Stack Relevance: Relevant
      • Rationale: Both Int32 and Single Max_Vector move to approximately 27 ns, which is consistent with a shared generated-code change. The commit's loop-test restriction can prevent the optimizer from unrolling these short traversals.
      • Candidates Considered:
        • 779bd79 - alternate broad JIT candidate
        • be7b579 - tensor-only candidate
    • Verification Status: Not verified; targeted Helix run produced no report

    NumberTensorPrimitives<Single>.BitwiseAnd_Scalar(BufferLength: 128) (+61.55%)

    • Delta: 9.896 ns → 15.987 ns (+61.55%)
    • Historical Context: μ=10.405 ns (σ=1.694, n=299); z-score=3.295; adaptive threshold=32.56%
    • Assessment: Step change despite high variance
    • Finding Confidence: 3/5 - Strong delta but CV=16.28%
    • Regression Confidence: 4/5 - Exceeds both adaptive and z-score thresholds and mirrors Int32
    • Likely Cause: 7693364 - "JIT: Skip unrolling tests stored in locals"
      • Affected Areas: JIT loop optimization, TensorPrimitives
      • Stack Relevance: Relevant
      • Rationale: The same scalar operation regresses for both Single and Int32, favoring shared code generation over type-specific behavior. Loss of unrolling is the most specific common mechanism in the range.
      • Candidates Considered:
    • Verification Status: Not verified; targeted Helix run produced no report

    FloatingPointTensorPrimitives<Single>.FusedMultiplyAdd_ScalarAddend(BufferLength: 3079) (+60.12%)

    • Delta: 263.934 ns → 422.606 ns (+60.12%)
    • Historical Context: μ=294.572 ns (σ=50.615, n=299); z-score=2.530; adaptive threshold=34.37%
    • Assessment: Step change with high variance
    • Finding Confidence: 3/5 - Significant result but CV=17.18%
    • Regression Confidence: 3/5 - Real signal is likely, but attribution is less direct for the long-buffer case
    • Likely Cause: 7693364 - "JIT: Skip unrolling tests stored in locals"
      • Affected Areas: JIT loop optimization, TensorPrimitives
      • Stack Relevance: Relevant
      • Rationale: The long-buffer variant moves with the much stronger 128-element result, indicating a shared implementation-level change. The high variance limits attribution confidence until generated code or reruns isolate the candidate.
      • Candidates Considered:
        • 779bd79 - broad JIT alternative
        • be7b579 - tensor-specific alternative
    • Verification Status: Not verified; targeted Helix run produced no report

    NumberTensorPrimitives<Int32>.BitwiseAnd_Scalar(BufferLength: 128) (+54.92%)

    • Delta: 9.975 ns → 15.453 ns (+54.92%)
    • Historical Context: μ=9.275 ns (σ=2.063, n=299); z-score=2.995; adaptive threshold=44.49%
    • Assessment: Step change with high variance
    • Finding Confidence: 3/5 - CV=22.24% lowers precision despite a significant delta
    • Regression Confidence: 3/5 - Both adaptive and z-score criteria pass, with matching Single corroboration
    • Likely Cause: 7693364 - "JIT: Skip unrolling tests stored in locals"
      • Affected Areas: JIT loop optimization, TensorPrimitives
      • Stack Relevance: Relevant
      • Rationale: The same benchmark shape regresses for Single, and the cross-library cluster points to JIT code generation. High historical variance prevents stronger confidence without a clean boundary rerun.
      • Candidates Considered:
    • Verification Status: Not verified; targeted Helix run produced no report

    FloatingPointTensorPrimitives<Single>.Truncate(BufferLength: 128) (+39.70%)

    • Delta: 11.251 ns → 15.718 ns (+39.70%)
    • Historical Context: μ=9.854 ns (σ=1.631, n=300); z-score=3.595; adaptive threshold=33.10%
    • Assessment: Step change with elevated variance
    • Finding Confidence: 4/5 - Significant z-score and predominantly elevated post-change values
    • Regression Confidence: 4/5 - Strong signal aligned with the short TensorPrimitives cluster
    • Likely Cause: 7693364 - "JIT: Skip unrolling tests stored in locals"
      • Affected Areas: JIT loop optimization, TensorPrimitives
      • Stack Relevance: Relevant
      • Rationale: The short-loop operation changes with Round, Max, and FMA variants. The JIT commit supplies a common mechanism through reduced unrolling eligibility.
      • Candidates Considered:
    • Verification Status: Not verified; targeted Helix run produced no report

    Ascii.ToUpperInPlace_Chars(Size: 128) (+27.71%)

    • Delta: 18.392 ns → 23.488 ns (+27.71%)
    • Historical Context: μ=18.532 ns (σ=2.196, n=300); z-score=2.257; adaptive threshold=23.70%
    • Assessment: Gradual drift with a significant endpoint
    • Finding Confidence: 3/5 - Adequate history, but the series had already shifted
    • Regression Confidence: 3/5 - Above thresholds, though the drift weakens precise commit attribution
    • Likely Cause: 7693364 - "JIT: Skip unrolling tests stored in locals"
      • Affected Areas: JIT loop optimization, Text
      • Stack Relevance: Relevant
      • Rationale: ASCII in-place casing is another short loop with no directly relevant Text library commit in the window. The shared JIT mechanism is plausible, but historical drift means this endpoint may include an earlier trend.
      • Candidates Considered:
        • 779bd79 - broad JIT alternative
        • d6299e4 - no-assembly-diff JIT cleanup
    • Verification Status: Not verified; targeted Helix run produced no report

    Ascii.ToLowerInPlace_Chars(Size: 128) (+25.49%)

    • Delta: 18.347 ns → 23.024 ns (+25.49%)
    • Historical Context: μ=18.660 ns (σ=2.088, n=299); z-score=2.090; adaptive threshold=22.38%
    • Assessment: Gradual drift with a significant endpoint
    • Finding Confidence: 3/5 - Adequate history but elevated variance and drift
    • Regression Confidence: 3/5 - Corroborated by ToUpper, but not isolated to one commit
    • Likely Cause: 7693364 - "JIT: Skip unrolling tests stored in locals"
      • Affected Areas: JIT loop optimization, Text
      • Stack Relevance: Relevant
      • Rationale: ToLower and ToUpper move together, making a shared generated-code change more likely than benchmark noise. The drift classification requires caution because part of the movement may predate the commit window.
      • Candidates Considered:
        • 779bd79 - alternate broad JIT candidate
        • d6299e4 - unlikely no-assembly-diff cleanup
    • Verification Status: Not verified; targeted Helix run produced no report

    NumberTensorPrimitives<Int32>.AddMultiply_ScalarMultiplier(BufferLength: 128) (+17.18%, borderline)

    • Delta: 16.216 ns → 19.001 ns (+17.18%)
    • Historical Context: μ=16.875 ns (σ=1.440, n=299); z-score=1.476; adaptive threshold=17.07%
    • Assessment: Borderline step change only 0.11 percentage points above threshold
    • Finding Confidence: 3/5 - Extensive history but conflicting delta and z-score signals
    • Regression Confidence: 2/5 - Weak standalone signal; supported only by the broader cluster
    • Likely Cause: 7693364 - "JIT: Skip unrolling tests stored in locals"
      • Affected Areas: JIT loop optimization, TensorPrimitives
      • Stack Relevance: Relevant
      • Rationale: If real, it likely shares the loop-optimization cause seen in stronger TensorPrimitives tests. Its weak z-score requires an isolated rerun before treating it as confirmed.
      • Candidates Considered:
    • Verification Status: Not verified; targeted Helix run produced no report

    FloatingPointTensorPrimitives<Single>.Round(BufferLength: 3079) (+23.57%, borderline)

    • Delta: 111.784 ns → 138.134 ns (+23.57%)
    • Historical Context: μ=117.806 ns (σ=34.343, n=296); z-score=0.592; adaptive threshold=58.30%
    • Assessment: Mixed series with very high variance; endpoint is below the adaptive threshold
    • Finding Confidence: 2/5 - CV=29.15% and conflicting post-change values
    • Regression Confidence: 2/5 - Borderline classification depends on elevated post-change mean, not a significant endpoint
    • Likely Cause: 7693364 - "JIT: Skip unrolling tests stored in locals"
      • Affected Areas: JIT loop optimization, TensorPrimitives
      • Stack Relevance: Relevant
      • Rationale: The candidate is retained because the 128-element Round case is a clear regression, but this long-buffer result is not statistically significant on its own. Additional runs are necessary.
      • Candidates Considered:
    • Verification Status: Not verified; targeted Helix run produced no report

    BitArray.BitArrayAnd(Size: 512) (+35.88%, borderline)

    • Delta: 11.021 ns → 14.976 ns (+35.88%)
    • Historical Context: μ=12.605 ns (σ=2.196, n=299); z-score=1.079; adaptive threshold=34.84%
    • Assessment: Borderline step change, narrowly above threshold with high variance
    • Finding Confidence: 3/5 - Extensive history but weak z-score
    • Regression Confidence: 2/5 - Corroborated by BitArrayXor but not independently strong
    • Likely Cause: 7693364 - "JIT: Skip unrolling tests stored in locals"
      • Affected Areas: JIT loop optimization, Collections
      • Stack Relevance: Relevant
      • Rationale: BitArrayXor provides a stronger signal from the same loop-based implementation family. The shared JIT cause is plausible, but this result needs rerun confirmation.
      • Candidates Considered:
        • 779bd79 - alternate broad JIT candidate
        • d6299e4 - unlikely no-assembly-diff cleanup
    • Verification Status: Not verified; targeted Helix run produced no report

    Span<Int32>.Fill(Size: 3000) (+27.10%, borderline)

    • Delta: 102.142 ns → 129.821 ns (+27.10%)
    • Historical Context: μ=118.351 ns (σ=12.315, n=298); z-score=0.931; adaptive threshold=20.81%
    • Assessment: Drift in a strongly multimodal history
    • Finding Confidence: 2/5 - Historical modes include many prior measurements near the compare value
    • Regression Confidence: 2/5 - Delta passes the adaptive threshold, but z-score and history are weak
    • Likely Cause: 7693364 - "JIT: Skip unrolling tests stored in locals"
      • Affected Areas: JIT loop optimization, Span
      • Stack Relevance: Relevant
      • Rationale: Span.Fill is compatible with the shared JIT-loop hypothesis and co-occurs with a sibling issue containing Span regressions. Its multimodal history prevents reliable attribution without successful boundary measurements.
      • Candidates Considered:
        • 779bd79 - alternate broad JIT candidate
        • d6299e4 - unlikely no-assembly-diff cleanup
    • Verification Status: Not verified; this representative test was submitted to Helix but no report was returned

    Open Questions

    • Historical Data: Sufficient for every test, but CV exceeds 10% for many tests; Span<Int32>.Fill is strongly multimodal, and the ASCII tests show drift rather than a clean step.
    • Confidence Limitations: The 28-commit range contains two plausible product-changing JIT commits. The leading loop-unrolling attribution is mechanistically strong but not experimentally isolated.
    • Verification Needed: Rerun representative benchmarks at ffc818f, 779bd79, and 7693364, then inspect JIT disassembly for lost unrolling.
    • Bisection Status: Not completed. A targeted Helix job for four builds and three representative tests completed but returned no benchmark report.
    • Correlation: Sibling issue #80369 reports concurrent Windows/x64 CoreCLR slowdowns in Span and collections on the same date. This supports a shared runtime cause but does not isolate a commit.

    Recommended Actions

    1. Retry boundary verification - Run OnesComplement(128), BitArrayXor(512), and Span<Int32>.Fill(3000) at ffc818f, 779bd79, and 7693364.
    2. Review generated code - Compare JIT disassembly before and after 7693364, focusing on loop-test temporaries, unroll decisions, branch count, and vectorized loop structure.
    3. Recheck borderline tests - Collect isolated reruns for AddMultiply, Round(3079), BitArrayAnd, and Span.Fill before including them in a fix validation gate.

    Bisection Results

    Test Status Culprit Commit Relevance Reported Diff (issue) Bisected Diff (at culprit)
    Max_Vector(BufferLength: 128) 🔁 Did not reproduce - - 15.8→27.1 ns (+72%) ≈ (baseline ≈ head)
    BitArrayXor(Size: 512) ✅ Culprit found 8b056052d60b UNRELATED 11.1→20.9 ns (+89%) 11.3→20.3 ns (+80%)
    ToUpperInPlace_Chars(Size: 128) 🔁 Did not reproduce - - 18.4→23.5 ns (+28%) ≈ (baseline ≈ head)
    Fill(Size: 3000) ✅ Culprit found be7b579e4230 UNRELATED 102.1→129.8 ns (+27%) 102.3→129.8 ns (+27%)

    Total bisection time: 52m 4s
    Tests measured: 4/4
    Culprit found: 2/4

    Commit Relevance

    Bisection localized commits whose functional connection to the tests is not established. This does not negate any measured reproduction.

    System.Numerics.Tensors.Tests.Perf_NumberTensorPrimitives<Int32>.Max_Vector(BufferLength: 128)

    • Status: 🔁 Did not reproduce
    Bisection details
    • Baseline: 15.777 ns

    Per-commit measurements (oldest → newest) (ns)

    # Commit Result Measurement
    0 ffc818ff8b4c baseline 17.529 ns
    10 f98a059f8d6b - 13.993 ns
    18 d6299e4d0a5e - 15.673 ns
    28 b60e14acce3b head 16.432 ns

    Helix jobs

    Job ID
    4bd31da9-bb23-4f0a-bf6a-d51ac9e179fd

    System.Collections.Tests.Perf_BitArray.BitArrayXor(Size: 512)

    Bisection details
    • Culprit: 8b056052d60b
    • Relevance: UNRELATED
    • Baseline: 11.067 ns
    • Culprit value: 20.298 ns

    Per-commit measurements (oldest → newest) (ns)

    # Commit Result Measurement
    0 ffc818ff8b4c baseline/good 11.043 ns
    10 f98a059f8d6b good 11.072 ns
    13 48da5e60f085 good 10.982 ns
    15 eb80f4f44af2 good 11.268 ns
    16 8b056052d60b culprit/bad 20.298 ns
    17 f17469bf36c5 bad 20.360 ns
    18 d6299e4d0a5e bad 13.201 ns
    28 b60e14acce3b head/bad 12.125 ns

    Helix jobs

    Job ID
    f3a5e1f2-0736-424b-a7b5-8ad39fc3a1cd
    89d238c4-afbb-4558-8c47-49d5a92477c1
    a28061c6-af46-4233-aa45-2da1bd8cae93
    f6a1a767-7fde-4a9a-ad32-fd8f40488949

    System.Text.Perf_Ascii.ToUpperInPlace_Chars(Size: 128)

    • Status: 🔁 Did not reproduce
    Bisection details
    • Baseline: 18.392 ns

    Per-commit measurements (oldest → newest) (ns)

    # Commit Result Measurement
    0 ffc818ff8b4c baseline 22.971 ns
    10 f98a059f8d6b - 19.411 ns
    18 d6299e4d0a5e - 17.819 ns
    28 b60e14acce3b head 19.420 ns

    Helix jobs

    Job ID
    ffe42442-0bc9-4d18-ac38-869d0bb6fbb1

    System.Memory.Span<Int32>.Fill(Size: 3000)

    • Culprit: be7b579e4230
    • Relevance: UNRELATED
    • Explanation: The measured good-to-bad transition is directly between f98a059 and be7b579. Inspection of the culprit commit for https://www.github.com/dotnet/runtime/pull/135060 shows changes confined to System.Numerics.Tensors implementation, documentation, and tests. It does not modify Span.Fill, System.Private.CoreLib, JIT/code-generation, hardware-intrinsic, or shared memory-operation implementation used by System.Memory.Span.Fill, so the benchmark regression is not causally related to the commit's code changes.
    Bisection details
    • Culprit: be7b579e4230
    • Relevance: UNRELATED
    • Baseline: 102.142 ns
    • Culprit value: 129.823 ns

    Per-commit measurements (oldest → newest) (ns)

    # Commit Result Measurement
    0 ffc818ff8b4c baseline/good 102.058 ns
    10 f98a059f8d6b good 102.273 ns
    11 be7b579e4230 culprit/bad 129.823 ns
    12 516229e42697 bad 129.581 ns
    13 48da5e60f085 bad 129.803 ns
    16 8b056052d60b bad 129.585 ns
    18 d6299e4d0a5e bad 129.602 ns
    28 b60e14acce3b head/bad 129.602 ns

    Helix jobs

    Job ID
    4fb0c99c-40a7-4399-a1e7-282e39c48b37
    a06f7566-9e17-4920-ac11-5f760602c050
    37616119-6b9a-4a3a-855f-d1abd36a41dd

    🤖 Proposed Next Actions

    Rule: R5_look_again — Uncertain — flag for re-triage.

    Confidence is sufficient (finding 4/5, regression 4/5), but no bisection result had commit_relevance = RELATED without an alignment warning.

    # Action Status Details
    1 Add label ✅ Done Look Again
    2 Remove label ⏭️ Skipped (dry-run) untriaged

    🦆 Pre-bisection Re-analysis (advisory)

    ⚠️ Disputes the pre-bisection plan — advisory only, not applied

    Flags: unsupported-candidate, wasted-bisection-slot

    Rationale: Two queued tests have no corresponding per-finding signal, so their inclusion is unsupported and risks wasting expensive bisection slots. Replace them with high-confidence actionable findings covering distinct tensor operation families.

    Suggested drop from bisection: System.Text.Perf_Ascii.ToUpperInPlace_Chars(Size: 128), System.Memory.Span<Int32>.Fill(Size: 3000) (advisory — not applied)

    Suggested add to bisection: System.Numerics.Tensors.Tests.Perf_FloatingPointTensorPrimitives<Single>.Round(BufferLength: 128), System.Numerics.Tensors.Tests.Perf_BinaryIntegerTensorPrimitives<Byte>.OnesComplement(BufferLength: 128) (advisory — not applied)

    This critique is advisory in the current configuration and did not change which tests were bisected.

    🦆 Re-analysis (advisory)

    ⚠️ Disputes the analysis — advisory only, not applied

    Flags: overconfident, weak-bisection-evidence, unsupported-culprit, possible-noise

    Rationale: The relevant bisection was inconclusive, while the successful bisections identified unrelated commits, and no quantitative history evidence is provided to justify 4/5 regression confidence. The per-finding culprit was not surfaced by the reported bisection and should be treated as unsupported.

    Disputed culprit: 7693364c5fef379683b324b82a0b511895e4c37c (advisory — not applied)

    Suggested confidence: Finding Confidence → 3/5; Change Confidence → 2/5 (advisory — not applied)

    This critique is advisory in the current configuration and did not change the confidences, culprit, or proposed actions above.


    Generated by PerfTriageAgent on 2026-10-06 10:52 UTC

  2. LoopedBard3 commented on Oct 6, 2026

    @LoopedBard3
    Member

    Tensor related tests are likely impacted by #135060, others are not as clearly impacted. FYI @tannergooding

  3. dotnet-policy-service commented on Oct 6, 2026

    @dotnet-policy-service
    Contributor

    Tagging subscribers to this area: @dotnet/area-system-numerics-tensors
    See info in area-owners.md if you want to be subscribed.

Sign up for free to join this conversation on GitHub. Already have an account? Sign in to comment

Metadata

Metadata

Assignees

No one assigned

    Type

    No type

    Projects

    No projects

      Milestone

      No milestone

      Relationships

      None yet

      Development

      No branches or pull requests

      Issue actions