
The browser is the chart engine.
Twenty-eight chart types from one JSON spec. About 87 KB, zero dependencies,
accessible and server-rendered by default.





Website · Gallery · Builder · A million rows · Docs · ♥ Support

<script type="module" src="https://cdn.jsdelivr.net/npm/mayacharts/dist/element.js"></script>
<maya-chart
  style="height: 300px"
  spec='{"type":"bar","x":"month","y":"revenue","data":[{"month":"Jan","revenue":12},{"month":"Feb","revenue":19}]}'
></maya-chart>
That is a complete, animated, keyboard-navigable chart with a tooltip, a screen-reader data table and dark mode. No build step, no framework. Under a strict CSP without unsafe-inline styles, set the height from your stylesheet instead of style=.

One dot per customer, and the same dots fly between a waffle, bars and a spend swarm. Every mark is keyed, so an update moves what changed instead of redrawing. This is a units chart, one of the signature charts, and it is one line of spec. See every type move on the website.
- Small. Thirteen chart types with tooltips, drill, zoom, selection and animation in about 87 KB gzip, with no runtime dependencies. Fifteen more types (treemap, sunburst, sankey, chord, marimekko, waffle, radial, gauge, hexmap, boxplot, funnel, weave, units, orbit, constellation) are optional modules of 2.5 to 6.1 KB each.
- Passes the enterprise checklist. Works under a strict CSP with Trusted Types, meets WCAG 2.2 AA (axe-clean in light and dark), supports RTL, and every user-visible string is localisable.
- Renders on the server.
render(spec)is a pure function that returns an SVG string in Node or any runtime without a DOM.renderShellreturns a full chart that works before any JavaScript loads. - One JSON spec. No callbacks in the config, so a spec can be stored in a database, sent over the wire, or written by an LLM. A JSON Schema and llms.txt ship with the package.
- Any framework, or none. It is a custom element, so it works in React, Vue, Svelte, Angular, Astro and plain HTML.
Existing chart libraries were designed 2011-2016 and hand-roll animation, tooltip positioning, theming and framework wrappers. mayaCharts uses the modern platform instead: Custom Elements, Web Animations API, CSS Anchor Positioning + Popover, CSS custom properties with light-dark(), and container queries. This means it ships small, is accessible and SSR-safe by default, and stays low-maintenance. See the full landscape research for what exists.
No code yet? The chart builder lets you pick a chart, paste your data, map the fields and copy ready code for HTML, ThoughtSpot, React, Vue, Svelte, Angular or Node.
HTML:
<script type="module" src="https://cdn.jsdelivr.net/npm/mayacharts/dist/element.js"></script>
<maya-chart style="height: 300px">
  <script type="application/json">
    {
      "type": "bar",
      "x": "month",
      "y": "revenue",
      "data": [
        { "month": "Jan", "revenue": 12 },
        { "month": "Feb", "revenue": 19 }
      ]
    }
  </script>
</maya-chart>
JavaScript:
import "mayacharts/element";
const chart = document.querySelector("maya-chart");
chart.spec = { type: "bar", data, x: "month", y: "revenue", series: "region", stack: true };
chart.data = newRows; // animates the update
Where the element reads its spec from, in order of precedence: the spec property (and data, which sets it), then the JSON <script> child, then the spec attribute. A spec property you have set wins over any later change to the attribute, so set one source and leave the others alone. Assign chart.spec = undefined to fall back to the script child or the attribute.
Server-side rendering:
import { render, renderShell } from "mayacharts";
const svg = render(spec, { width: 640, height: 320 }); // bare SVG string
const html = renderShell(spec, { width: 640, height: 320 }); // full chart, works without JSTwenty-eight types from one spec format. Pick a picture to open that chart live in the gallery.
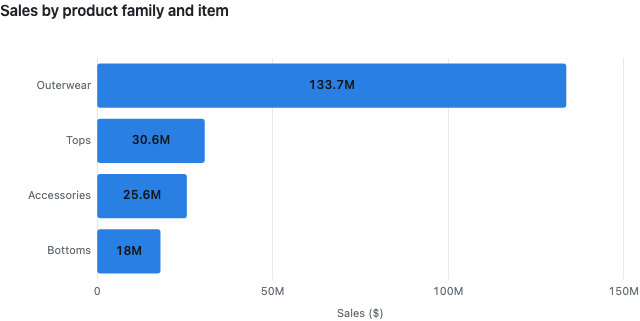 bar |
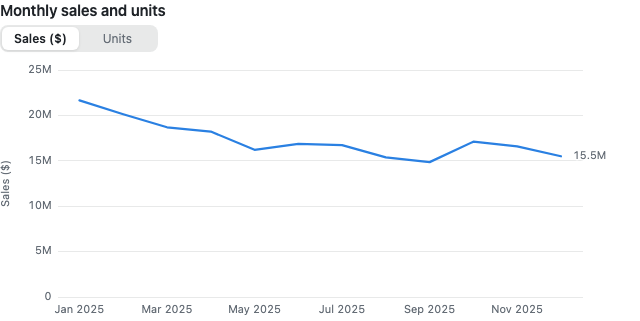 line |
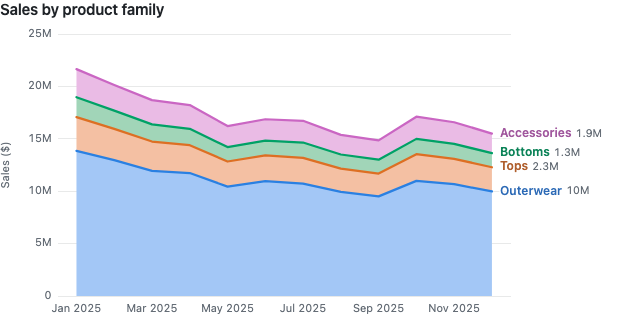 area |
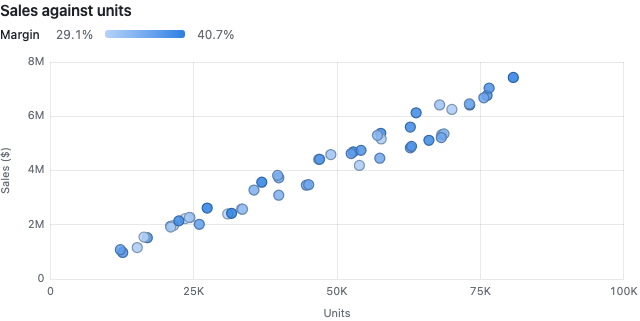 scatter |
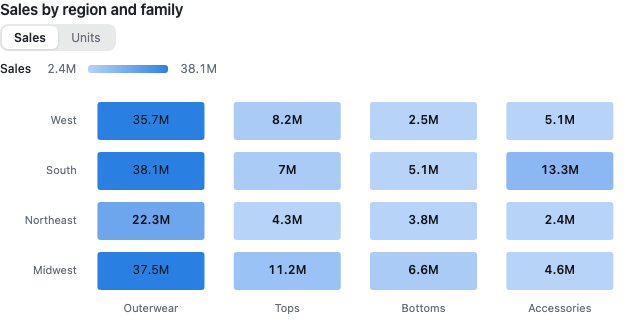 heatmap |
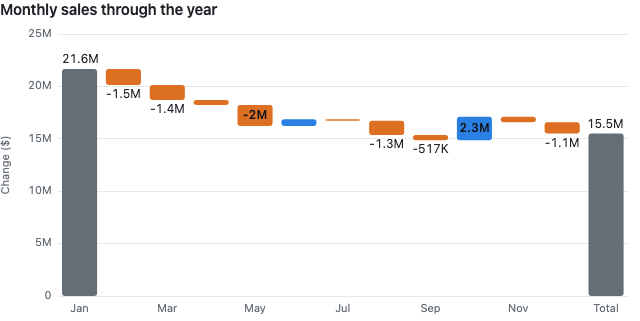 waterfall |
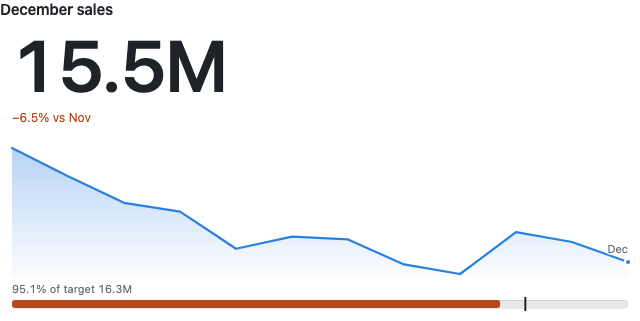 kpi |
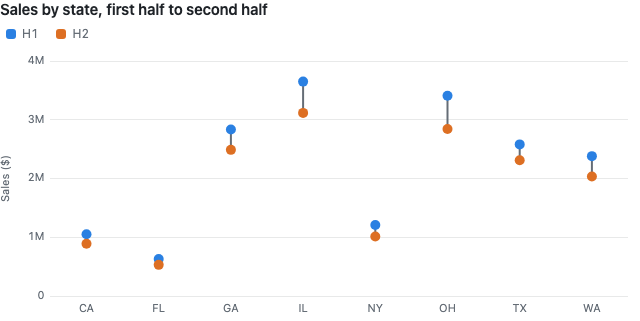 dumbbell |
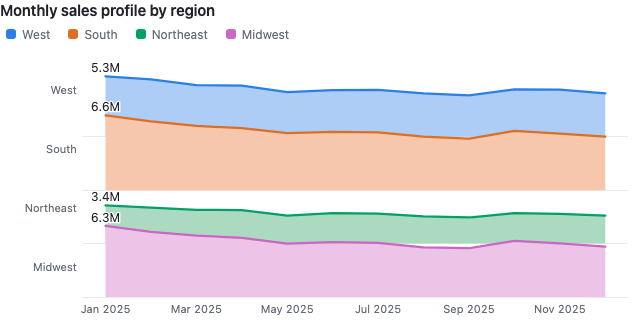 ridgeline |
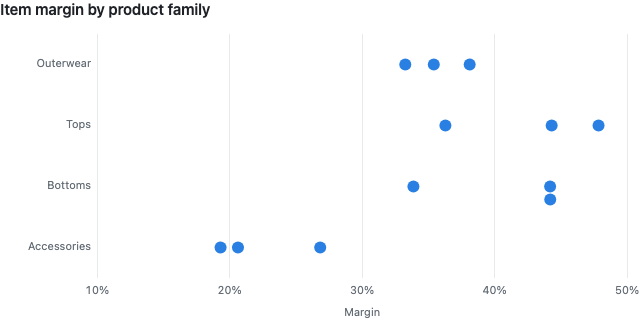 beeswarm |
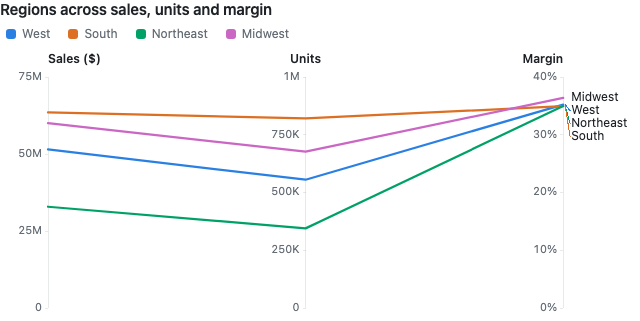 parallel |
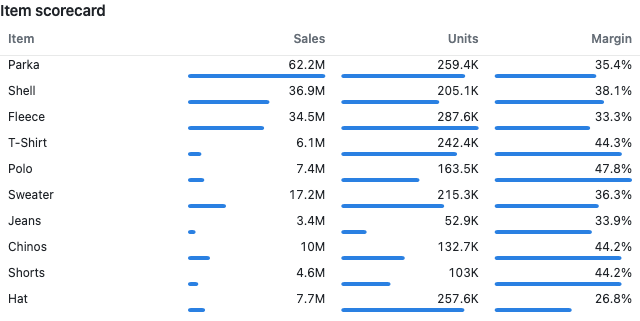 table |
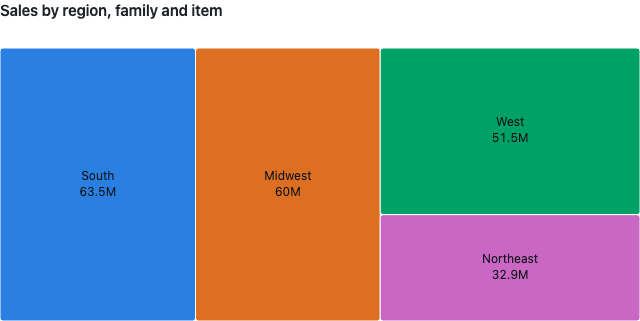 treemap |
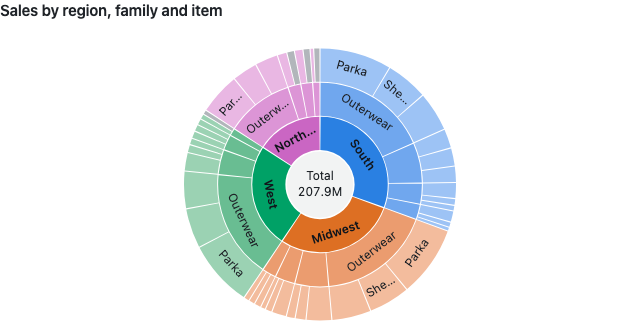 sunburst |
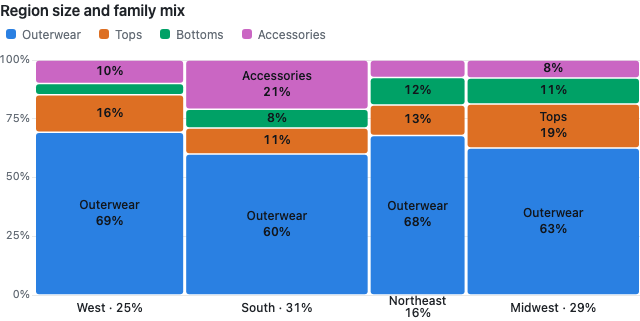 marimekko |
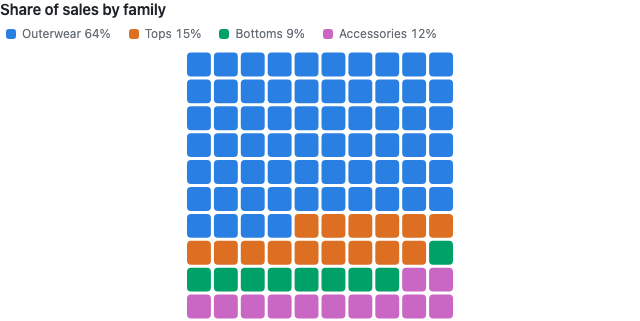 waffle |
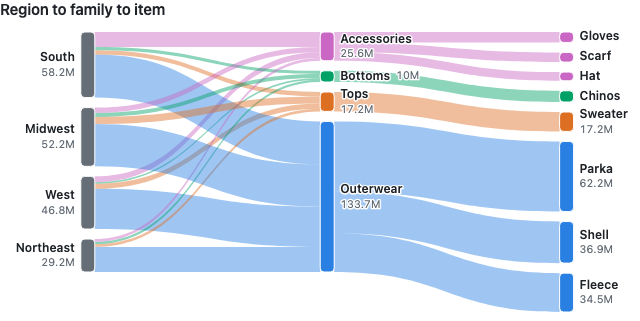 sankey |
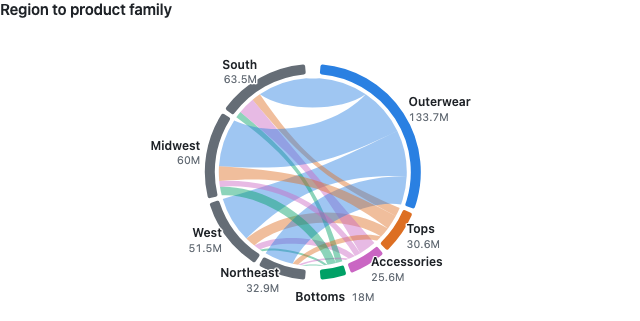 chord |
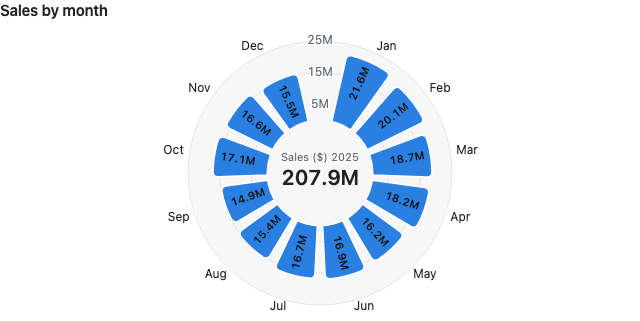 radial |
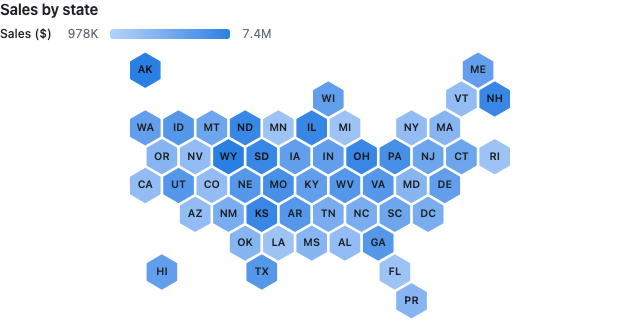 hexmap |
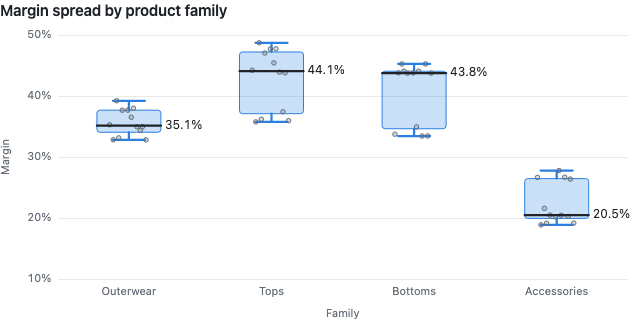 boxplot |
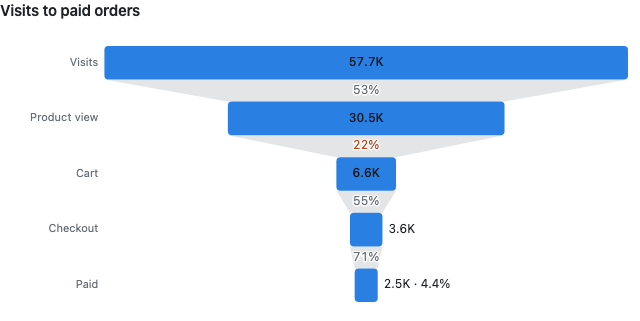 funnel |
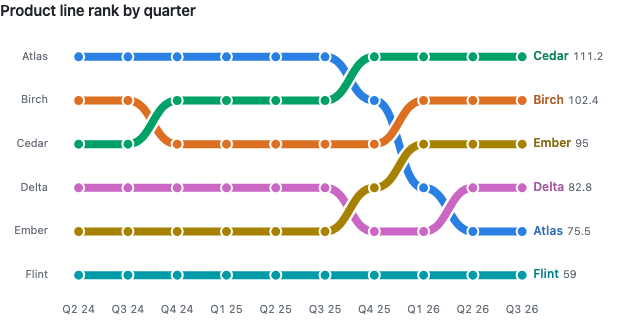 weave |
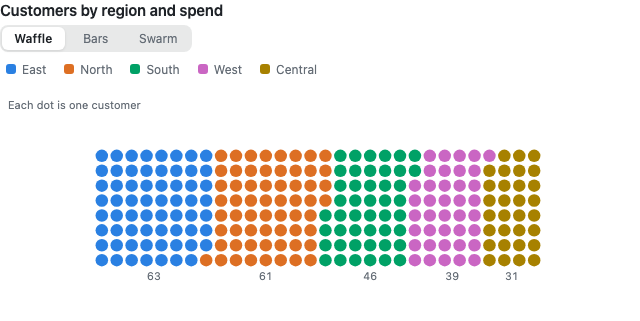 units |
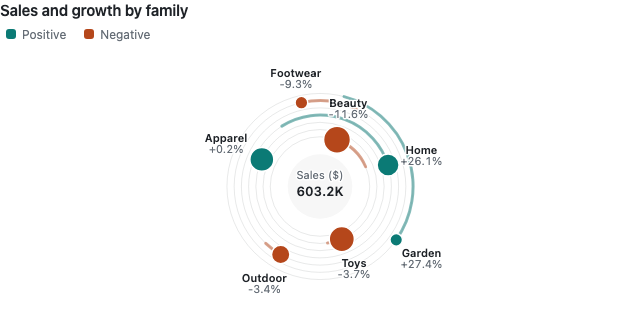 orbit |
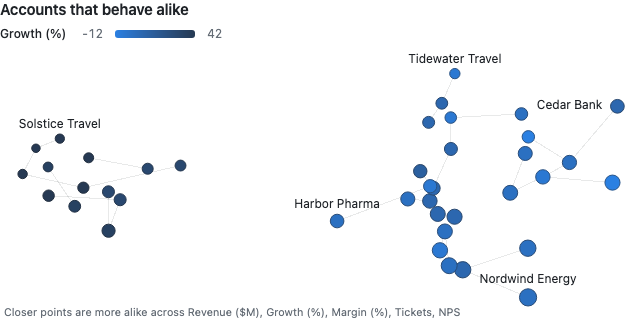 constellation |
The thirteen core types ship with mayacharts and mayacharts/element. Each other type is an optional module you import once for its side effect, so you pay only for the types you draw. Sizes are gzip, from npm run size.
What each type is for, and what it costs
| Type | Use it for | Import | Gzip |
|---|---|---|---|
bar |
Compare categories, stacked or grouped, with an Other bucket and optional ghosts of the previous value. | mayacharts |
in core |
line |
Trends over time, one series or several. | mayacharts |
in core |
area |
Totals over time and what each series contributes. | mayacharts |
in core |
scatter |
Two measures per row, with an optional size for bubbles. | mayacharts |
in core |
heatmap |
A value for every pair of categories, including a week by weekday calendar. | mayacharts |
in core |
waterfall |
How a start value becomes an end value through gains and losses. | mayacharts |
in core |
kpi |
One headline number with its change, a sparkline and progress to target. | mayacharts |
in core |
dumbbell |
Two values per category, such as before and after. | mayacharts |
in core |
ridgeline |
The shape of several distributions or seasonal profiles, stacked. | mayacharts |
in core |
beeswarm |
Every row as a dot along one axis, so spread and outliers stay visible. | mayacharts |
in core |
parallel |
Many measures per row on parallel axes, to spot patterns across them. | mayacharts |
in core |
table |
Rows and columns with inline bars, for when people need the exact numbers. | mayacharts |
in core |
list |
Numbered moves, each with its own number format, a sentence of evidence and bars that open on click. | mayacharts |
in core |
treemap |
Part of a whole as nested rectangles. | import "mayacharts/hierarchy" |
4.90 KB |
sunburst |
Part of a whole as rings, with drill-down. | import "mayacharts/hierarchy" |
4.90 KB |
marimekko |
Column width is the column total, segments are shares within it. | import "mayacharts/hierarchy" |
4.90 KB |
waffle |
A share as a grid of squares that people can count. | import "mayacharts/hierarchy" |
4.90 KB |
sankey |
Flow between stages, with drill into a node. | import "mayacharts/flow" |
4.13 KB |
chord |
Flow between every pair in a group. | import "mayacharts/flow" |
4.13 KB |
radial |
Bars around a circle, for cyclical categories such as months. | import "mayacharts/radial" |
6.12 KB |
gauge |
One value on a dial with a fixed range, toned by target and warn thresholds. | import "mayacharts/radial" |
6.12 KB |
hexmap |
US states as equal hexagons, so small states stay visible. | import "mayacharts/geo" |
2.98 KB |
boxplot |
Median, quartiles and outliers per group. | import "mayacharts/stats" |
3.91 KB |
funnel |
Drop-off through ordered stages. | import "mayacharts/stats" |
3.91 KB |
weave |
A ranking over time, with threads that pass over and under at crossings. | import "mayacharts/weave" |
2.65 KB |
units |
One dot per row that changes form between waffle, bars and swarm. | import "mayacharts/units" |
2.52 KB |
orbit |
Categories as planets around their total, with motion from growth. | import "mayacharts/orbit" |
2.53 KB |
constellation |
Accounts placed by how alike their measures are, not by one axis. | import "mayacharts/constellation" |
3.01 KB |
Five of the types above were designed for mayaCharts. None of them ships in Chart.js, ECharts, Recharts or Plotly. Each is a spec like any other and costs about 3 KB gzip or less (was is part of the core bar).
Shapeshifter (units). One dot per row, and the dots change form: a waffle, bars, or a swarm along the value axis. Every dot keeps the same key in every form, so switching form flies each dot to its new place instead of redrawing. Maya means illusion, and this is the one that earns the name. Other libraries make you pick a chart; here the control is part of the chart.
import "mayacharts/units";
chart.spec = { type: "units", x: "region", y: "spend", name: "customer", data: customers };
// forms defaults to ["waffle", "bars", "swarm"]; view.form picks the one shown; 1500 rows at most
Dhaka weave (weave). A ranking over time, woven like Dhaka cloth. Bump charts exist, but their lines just cross. Here the series that climbs passes over the one that falls at every crossing, with a halo under each thread so over and under read at a glance. Hover a dot to light its thread and see that period's order.
import "mayacharts/weave";
chart.spec = { type: "weave", x: "quarter", y: "sales", series: "line", data: rows };
// series is required, at most 8; a missing period breaks that thread
Memory (was). A bar chart that remembers. Name a column that holds the previous value and each bar gets a dashed ghost at that value, grows from the ghost on first paint, and the description gains a "Since ..." sentence naming the largest moves. The memory comes from your data, never from browser storage. It is part of the core bar, so there is nothing to import.
chart.spec = { type: "bar", x: "family", y: "sales", was: "before", data: rows };
// not with stack or a y array; a row whose was is not a number shows no ghost
Orrery (orbit). Categories as planets around their total. Orbit radius is rank (largest innermost), planet size is value, and orbital speed and direction follow growth, so a shrinking category circles the other way. The planets sweep in and keep turning, each name riding beside its planet; pointing at the chart stops them where they are, so a planet is easy to read and hover, and they carry on when the pointer leaves. A static trail arc shows the growth too, so the chart still reads with motion off: under reduced motion, with animate: false, in server rendering and in an exported image.
import "mayacharts/orbit";
chart.spec = { type: "orbit", x: "family", y: "sales", y2: "growth", data: rows };
// without y2 nothing moves; limit rolls the rest into a fixed Other planet
Constellation (constellation). Accounts placed by how alike their measures are, not by any one axis. Two or more measures are standardised and flattened to a sky by a deterministic PCA, so the same data always draws the same sky. Each star is joined to its nearest neighbour, and hovering one lights its three nearest.
import "mayacharts/constellation";
chart.spec = { type: "constellation", x: "account", y: ["spend", "tickets", "tenure"], data: rows };
// optional size; 500 rows and 12 measures at mostThe spec · Canonical examples · Modules · Global build · Interactions · Events · Export · Frameworks · Embedding · Theming · Security · Accessibility · Performance · Errors · Development · Support
The full field reference is also on the website at Docs.
Rule: x is always the category, y is always the value, whatever the orientation. yDomain is always the value axis. An option set to null is treated as unset (type and data still need values).
| Field | Type | Applies to | Default | Meaning |
|---|---|---|---|---|
$schema |
string | all | - | Ignored; for editors and LLMs |
type |
enum | all | required | bar line area scatter heatmap waterfall kpi dumbbell ridgeline beeswarm parallel table treemap sunburst sankey chord marimekko waffle radial gauge hexmap boxplot funnel weave units orbit constellation |
data |
Row[] | all | required | Row objects |
aggregate |
sum / mean / count / min / max / {ratio: [field, field]} / {[y field]: either} | all but boxplot (ratio: bar line area heatmap dumbbell table kpi gauge hexmap) | sum | How rows sharing a (category, series) combine; count counts non-null y. { ratio: [numerator, denominator] } sums both per group and divides (zero denominator: null), so a ratio such as price = sales / units is right in every category, drill level, Other and "mean" rule; y then only names the measure. Not with stack or was. With a y array that toggles the measure, key it by y field: { price: { ratio: ["sales", "units"] } } (unlisted fields sum) |
sort |
asc / desc / change | bar line area heatmap dumbbell table radial waffle orbit | data order | Categories by total across all series; "change" (dumbbell) by to minus from, largest gain first. With facet it orders the panels |
limit |
positive integer | bar line area heatmap dumbbell table radial waffle orbit | - | Keep top N categories; rest roll up into "Other". A bar past 10000 marks does this on its own when unset (see Large data). other: false drops the rest instead. With facet it keeps the top N panels |
| Field | Type | Applies to | Meaning |
|---|---|---|---|
x |
field | all but path types | Category; scatter numeric x; hexmap state; beeswarm optional row; funnel stage, omitted when y lists the stages |
xType |
auto / category / time | bar line area | How x is spaced: auto detects ISO 8601 dates for a time axis; else categories. "time" accepts epoch ms. Default auto. |
y |
field or field[] | all | Value; array adds measure toggle (all-y types: axes/columns; funnel without x: one stage per field; kpi: one tile per field, or one at a time with toggle; gauge: only with toggle, no x or series) |
toggle |
boolean | kpi gauge | With a y array, one measure at a time behind the measure control (view.measure): a kpi draws one tile instead of one per field; a gauge takes a y array only with it. aggregate, was, yDomain and colorBy may then be keyed by y field |
series |
field | bar line area scatter heatmap dumbbell ridgeline beeswarm parallel marimekko radial boxplot weave constellation | Split into series; heatmap row category; dumbbell exactly two (from, to); boxplot boxes side by side; weave one thread each (required); constellation colours stars by group |
path |
field[] | treemap sunburst sankey chord; bar line area dumbbell table radial waffle hexmap waterfall marimekko heatmap with drill; list | Hierarchy outer to inner; replaces x (heatmap: replaces series, the rows). chord: 2 or 3 levels (a third splits the target arcs, the sources stay); hexmap: a drilled state draws its children as bars; marimekko without series: the next level is the series; list: [headline, evidence] |
seriesPath |
field[] | bar line area | Series hierarchy: the series is the current level and the drill gesture on a mark splits its series into the next (view.drill). Not with path or series |
xPath |
field[] | heatmap | Column hierarchy: replaces x and drills on its own from a column header (view.xDrill), beside path on the rows |
depth |
positive integer | treemap | Levels drawn at once below the current branch, each parent holding its children under a name strip; a click drills into the parent under the pointer. Default 1 with drill, every level without |
minAngle |
whole degrees | sunburst | Slices narrower than this fold into one grey "Other (n)" per ring (the largest sibling never folds). 0 folds nothing. Default: slices under 4 px across fold, so how many depends on the chart size |
size |
field | scatter beeswarm constellation | Bubble or star area (sqrt scale) |
name |
field | scatter beeswarm boxplot units | Point identity and tooltip title; units one dot per row |
body |
field | list | Text under each headline (two lines at most on small tiles) |
rowFormat |
field | list | Each row's own format: a preset or a template such as "{value} pts" |
totals |
string[] / true | waterfall heatmap | x values drawn as running-total bars; one before any step opens at its own y. heatmap true: a Total row and column, combined by aggregate over the visible rows |
start |
string | waterfall | x value of the opening total, drawn first at its own y. A drilled step opens at the running total before it and closes after it (text.before, text.after) |
stack |
boolean / "percent" / "stream" / modes[] | bar area | Stack series instead of grouping; "percent" shows shares of each category's visible total (axis 0 to 100%, y formatted as percent unless format sets it); "stream" (area) centres the stack on a wiggle baseline, a streamgraph with the value axis and grid off by default. An array of 2 or more distinct modes ([true, "percent"]; false: grouped bars, overlaid areas) adds a Layout control that switches between them, first shown (view.stack) |
horizontal |
boolean | bar dumbbell | Categories on the left axis |
y2 |
field | bar orbit | Second value field as a line on right axis (vertical bars only); orbit: growth, which sets planet speed and direction |
was |
field / {by, current?, previous?} / {[y field]: field} | bar line area kpi gauge heatmap | Previous value: a ghost bar over each bar keyed in the legend, "was" in the tooltip, a table column and a description sentence naming the 2 largest moves (kpi: a second comparison; gauge: a marker at the old value and a change line, in points on a percent measure; heatmap: a "was" tooltip row and table column). Long data: { by: "year" } takes the latest period as current and the one before it as previous, titled by that period. With a y array, key it by y field ({ sales: "salesLY" }): the ghosts follow the measure toggle (kpi tiles: one each). With series (bar): one ghost per grouped bar. line and area: a dashed ghost line per series. Heatmap calendar form: { by } equal to series compares each cell with the same x under the previous series value (the year before), and the first series value has none. Not with stack |
compare |
("previous" / "was" / "target")[] | kpi | Which change lines print under the headline, in this order; the target bullet and status stay. [] prints none. Default all three |
numberMotion |
"count" / "roll" | kpi | How the headline moves to a new number (element only; off under reduced motion): count up, or roll each digit like an odometer. Default "count" |
back |
spec without data | kpi | A second face: a chart spec of any type but kpi over the kpi's rows. A Details button turns the card over (view.face); Escape returns. It takes the kpi's format, titles, locale, currency and theme unless it sets them, and with limit it keeps just those rows (other defaults to false). |
arc |
180 / 270 / 360 | gauge | Sweep of the dial in degrees; 360 is a closed ring. Default 180 |
forms |
("waffle" / "bars" / "swarm")[] | units | Forms a units chart switches between, first shown (view.form picks another); a form control appears with 2 or more. Default all three |
form |
"bars" / "line" | radial | "line" is a radar: one closed line per series (angle = x, radius = y from zero); dash draws series dashed. Default "bars" |
zero |
boolean | dumbbell | false fits the value axis to the values (recomputed at each drill level) instead of starting at zero. Default true |
frame |
field | bar line area scatter dumbbell kpi | Playback: one frame per distinct value, the last shown by default (view.frame picks another); the title names the frame and the value axes span every frame. The element adds a Play button (frameControl picks a slider, tabs or a select). kpi: a scope (YTD or All) shown one at a time |
| Field | Type | Default | Meaning |
|---|---|---|---|
format |
preset / template / options | auto | Per field or one string for all measures; display only. Template: "{value:percent} gross". Intl options also take prefix and suffix: { gap: { maximumFractionDigits: 1, suffix: " pts" } } |
titles |
{[field]: string} | field names | Display names everywhere (axis, tooltip, legend, table) |
labels |
boolean | false (heatmap: true at ≥24 px; treemap, sunburst: names; marimekko: shares, on unless false) | Formatted value on marks |
text |
{[key]: string} | English | Localisable UI strings with {0} placeholders; llms.txt and the docs list what each key controls |
locale |
BCP 47 | en-US | Formatting locale |
currency |
ISO 4217 | USD | Currency for the currency preset |
title |
string | - | Visible heading and accessible name. Data tokens: {max.x} {max.y} {min.x} {min.y} {first.x} {first.y} {last.x} {last.y} {total} {mean} {total.base} {count.below} {count.above}, formatted by format ({total.base} is {total} without scale; the counts are drawn values below, and at or above, the colorBy target); any other brace text stays as written. Without a selector max, min, first and last read one point (stacked: category totals) and {total} sums every series; a series selector such as {last.y:2025} or {total:2025} reads only that series. Scatter: max and min by y, first and last by x, .x the x value or name. With no rows a title holding a token is dropped. In a tile under 200 px tall the title is one line with an ellipsis |
subtitle |
string | - | Second line under the title, smaller and muted; same data tokens; hidden in a tile under 200 px tall. Not in the bare render() SVG |
description |
string | auto | Accessible description |
yDomain |
[min, max] / {[y field]: [min, max]} | - | Fixed value-axis domain; [hi, lo] reverses it (ranks with 1 on top). kpi: bullet scale; gauge: dial range. Not with a y array, except keyed by y field on kpi and gauge ({ sales: [0, 26e6] }) |
xDomain |
[min, max] | - | Fixed x domain (scatter only) |
rules |
array | - | Up to 4 reference lines: n, "mean" or {y, label} across the value axis; {x, label} across the category axis; {band: [lo, hi], label} a shaded value range; {y2, label} across the right axis of a bar with y2; a number may be { param: "id" } (see params); bar line area scatter dumbbell beeswarm. With stack "percent" n is a share (0.5) and "mean" the mean segment share. Scatter: { slope: k | "mean", intercept, label } draws y = k * x + intercept ("mean" = sum of y / sum of x), labelled with its value as y per x ("Average price $38 per unit"), placed clear of the points. [] is the same as unset |
yScale |
"log" | linear | Log value axis; values must be above 0. line scatter beeswarm (a bar encodes its value as length from zero, so bars refuse it) |
xScale |
"log" | linear | Log x axis; x must be above 0. scatter only |
annotate |
("max" / "min" / "first" / "last" / {x, text})[] | - | Label those points of each series with their value (scatter: max and min by y, first and last by x); { x, text } labels the mark at that x. bar line area scatter. [] is the same as unset |
| Field | Type | Applies to | Default | Meaning |
|---|---|---|---|---|
tooltip |
boolean / {fields} | all (fields: bar line area scatter heatmap dumbbell beeswarm gauge) | true | Hover/keyboard tooltip. { fields: ["pricePerUnit"] } adds those fields as rows and table columns, formatted by format (bar, line, area, heatmap, dumbbell: combined by aggregate); { field, ratio: [num, den] } shows sum(num) / sum(den) under that name |
legend |
boolean / "top" / "bottom" / "right" | all | true with series, waffle, hexmap, units |
Legend; clicking toggles series. A position places it (true is "top"). Line and area: dropped when direct end labels show, unless set explicitly. |
endLabels |
boolean | line area | true | Name each series at its right end with its last value (2 to 8 visible series, no value labels, no y2; below 400 px the label is the value alone and the legend names the series). false brings back the legend. |
drill |
boolean | treemap sunburst sankey chord; bar line area dumbbell table heatmap radial waffle hexmap waterfall marimekko with path; bar line area with seriesPath or facet; heatmap with xPath |
false | Click/Enter zooms into a branch of path; breadcrumb, Back and Escape pop. With select: click selects, double-click or Shift+Enter drills. At the last level it fires maya-drill-leaf. Sankey: any node but the last column |
drillOut |
boolean | types that take drill |
true | With drill, a click on empty chart space goes back up one level |
expand |
spec without data / "first" / "none" / "all" | table list | none (list: "first") | table: a sub-chart under the row a click or Enter opens, over that row's rows (view.expanded, one row at a time). list: which moves start open |
drillTo |
spec without data | line with series |
- | A sub-chart over a drilled series' rows replaces the line (view.drill); was: "previous" compares with the series before it. Back and Escape return |
select |
true / "multi" / {peers} | bar line area waterfall scatter heatmap kpi dumbbell ridgeline beeswarm parallel table list marimekko waffle radial treemap sunburst hexmap boxplot funnel weave units orbit constellation | off | Click/Enter/legend selects marks; Escape or a click anywhere outside the chart clears. With drill, double-click or Shift+Enter drills. { peers: field } (beeswarm) also lights the marks sharing the selected one's value of that field, with their average (view.peers). kpi: the sparkline points. list: a move |
brush |
boolean | parallel | false | Drag a range on an axis to keep the lines inside it; ranges combine with AND, the rest dim, a click on the axis clears it (view.brush, reported by maya-view) |
zoom |
boolean | line area scatter | false | Drag to zoom, or + / = and - with the chart focused; Reset, double-click, Escape restore |
animate |
boolean | all (element only) | true | Animate the first draw and every update |
| Field | Type | Applies to | Meaning |
|---|---|---|---|
page |
positive integer | table | Rows shown at first; a "Show n more" row (text.showMore) adds n (view.page). The table grows and scrolls in the tile |
scroll |
boolean | table | Every row (at most 1000), scrolling inside the tile under a held header |
filter |
boolean | table | A search box (text.filter) keeping rows whose x or columns value contains the text (view.filter) |
columns |
field[] | table | Text fields as their own columns after the row label, sortable and filtered |
cells |
{[title]: {type: "strip", field, by, last?}} | table | A column of squares, one per distinct by value (the last last), holding field toned by sign |
bars |
{[y field]: "bar" / "diverging" / "none"} / boolean | table list | table: the bar in each measure cell (diverging grows left or right of the centre). list: true draws the evidence as bars on a scale local to each move |
| Field | Type | Applies to | Meaning |
|---|---|---|---|
facet |
field | bar line area | One panel per value (data order, or by total with sort; limit keeps the top n), each titled with its value and total, in a grid that scrolls past the tile height; panels under 240 x 150 px are sparklines. Every panel has every category, so the same x lines up across panels. With drill, a click opens one panel full size (view.drill). Not with path, seriesPath, drillTo, frame or zoom |
facetScale |
"shared" / "own" / ["shared", "own"] | bar line area | One value axis for every panel (default) or each its own; an array of both adds a Scale control (view.facetScale) |
frameControl |
"play" / "slider" / "both" / "tabs" / "select" | bar line area scatter dumbbell kpi | How the viewer moves between frames (default "play"); tabs become a select when they do not fit or under 300 px. Each sets view.frame |
frameSpeed |
ms | bar line area scatter dumbbell kpi | Milliseconds per frame while playing (default 900, 100 to 10000) |
trail |
positive integer | scatter | With frame and name: each name draws its previous n positions as fading dots on a line; a selected name shows its whole path. Off under 300 px |
other |
boolean | bar line area heatmap dumbbell table radial waffle orbit | With limit: false drops the rest instead of an "Other" category, so a race keeps each frame's own top N |
params |
[{id, label, min, max, step, value, suffix?, format?}] | all | Up to 4 sliders and a Reset button (a popover under 300 px). { param: "id" } stands in for a number in colorBy target and warn and in rules; view.params holds the values |
scale |
{where?, by: [param ids], mode?: "percent"} | all | What-if: rows matching every where field have each y field multiplied by (1 + p / 100) per param in by. Not with a ratio aggregate |
| Field | Type | Applies to | Default | Meaning |
|---|---|---|---|---|
colors |
string[] or {[name]: color} | all | theme palette | An array holds at most 8 distinct colours; a map takes any number of names and its keys beat colorBy tones, which beat theme.series1 to series8, which beat the array, which beats the accent; a value ramp ignores the map. A map is keyed by series value; treemap and sunburst by path[0] value; sankey and chord by node name (links and inner levels inherit); waffle by category; weave with a group colorBy, and tint with path, by group or path value; unmatched keys are ignored. Path types keep each name's colour through drill; a sankey root missing from the map takes theme neutral at every level |
dash |
string[] | line area radial | - | Series values drawn dashed, such as last year (radial with form: "line"); needs series; [] is the same as unset |
emphasis |
string[] | line | - | Series values drawn with a heavier stroke (theme lineEmphasis); needs series; [] is the same as unset |
colorScale |
"linear" / "rank" / "quantile" / "log" | heatmap hexmap | "linear" | How values map to the colour ramp: rank gives even steps by order (skewed totals), quantile up to five equal-count classes (ties merge), log needs values above 0 |
tint |
boolean | treemap sunburst sankey chord waffle weave | false | Children take evenly spaced tints of their parent's colour: drilled levels of a path, and weave threads under a group colorBy |
colorBy |
"sign" / {target, warn, better} / {[y field]: {target, warn, better}} / field | bar line area waterfall scatter dumbbell kpi gauge treemap sunburst hexmap units orbit constellation weave | - | Tone by sign or target (at or past it is good; better: "lower" flips it), or ramp by numeric field. Not with series (weave: a group field, one colour per group from colors, up to 20 threads). Only kpi and gauge take warn (on the bad side of target, the "at risk" band) or omit target; a kpi with a y array may key thresholds by y field. target and warn may be { param: "id" } |
theme |
{[token]: css} / name / [name, {[token]: css}] | all | {} | Theme tokens (CSS values, allowlisted), a registered theme's name, or [name, overrides]; see Theming for the tokens. registerTheme(name, tokens) adds a name; mayacharts/themes registers 18 |
grid |
boolean | all | true | Grid lines perpendicular to the value axis |
xAxis |
boolean | all | true | Bottom axis |
yAxis |
boolean | all | true | Left axis |
table |
boolean | all | true | Visually hidden data table for screen readers |
Dates in x values are automatically detected and placed on a proportional time axis when using line, area or vertical bar charts. ISO 8601 dates are recognized as year-month ("2024-03"), full date ("2024-03-05") or date-time ("2024-03-05T14:30:00Z"); a date-time without an offset is read as UTC. A bare year such as "2024" stays a category. Numbers are never auto-detected as dates; use xType: "time" explicitly to interpret them as epoch milliseconds. A time axis preserves the chronological order and spacing of dates, so sort and limit options keep a category axis instead. To disable time axis detection and use a category axis with ISO dates, set xType: "category". All ticks and boundaries are placed at UTC calendar boundaries.
The Scale page draws eleven charts from up to a million rows generated in your browser and shows the rows in, the marks drawn and the draw times measured on your machine.
A chart handles up to a million rows wherever the chart makes sense, by reducing what it draws, never by dropping the data table or hiding the reduction. Line and area charts reduce long series to about one point per 2 px of plot width (at most 1000 categories, and 4000 shared between series) using the LTTB (Largest Triangle Three Buckets) downsampling algorithm, keeping each series' first, last, minimum and maximum points so trends and extremes remain visible. A time axis reduces whenever it has more points than that budget; a category axis reduces past 1000 categories, over the category index. A kpi thins its sparkline the same way. The data table and screen reader description indicate how many points are displayed. A bar with more categories than fit (past 10000 marks) and no limit keeps the top N by total, N being 10 per 40 px of plot width, and rolls the rest into "Other". The automatic cut ranks by absolute total, so a large negative bar stays; an explicit limit ranks by signed total. Scatter charts above 10000 visible points are drawn as density cells. A table draws the rows that fit its height, and its hidden data table lists the first 1000. The bar roll-up also puts a sentence in renderParts(...).warnings. Charts that cannot reduce without changing meaning (waterfall, dumbbell, parallel and the module charts) fail with too-many-marks, naming the mark count, the 10000 cap and the row count, and suggest limit or aggregate.
The row pass (grouping, aggregation, time parsing, validation) is cached per data array: a resize, legend toggle, zoom or view change re-renders without walking the rows again, so at a million rows a re-render of a line, bar, scatter or kpi costs tens of milliseconds. The cache is keyed by the array's identity, length, first row and last row, so a push, a shift or a replaced last row is noticed; after editing any other row in place, assign a new array (chart.data = [...rows]).
One working spec for each common shape. Paste any of them into the builder to see it drawn.
Show all 28 specs
Currency bar
{
  "type": "bar",
  "x": "month",
  "y": "revenue",
  "format": "currency",
  "data": [{ "month": "Jan", "revenue": 10500 }]
}
Stacked bar
{
  "type": "bar",
  "x": "state",
  "y": "units",
  "series": "region",
  "stack": true,
  "data": [{ "state": "CA", "region": "West", "units": 120 }]
}
Horizontal sorted limited labelled bar
{
  "type": "bar",
  "horizontal": true,
  "x": "product",
  "y": "margin",
  "sort": "desc",
  "limit": 5,
  "labels": true,
  "data": [{ "product": "A", "margin": 22 }]
}
Sign-coloured percent bar
{
  "type": "bar",
  "x": "metric",
  "y": "variance",
  "format": "percent",
  "colorBy": "sign",
  "data": [{ "metric": "revenue", "variance": 0.15 }]
}
Multi-measure line with date format and zoom
{
  "type": "line",
  "x": "date",
  "y": ["revenue", "units"],
  "zoom": true,
  "format": { "date": "date", "revenue": "currency" },
  "data": [{ "date": "2024-01-01", "revenue": 10000, "units": 50 }]
}
Stacked area
{
  "type": "area",
  "x": "month",
  "y": "sales",
  "series": "region",
  "stack": true,
  "data": [{ "month": "Jan", "region": "North", "sales": 1500 }]
}
Waterfall with totals
{
  "type": "waterfall",
  "x": "stage",
  "y": "amount",
  "totals": ["Q1", "FY"],
  "data": [{ "stage": "Q1", "amount": 100 }]
}
Bubble scatter with select
{
  "type": "scatter",
  "x": "population",
  "y": "gdp",
  "size": "area",
  "name": "country",
  "select": "multi",
  "data": [{ "country": "USA", "population": 331, "gdp": 23, "area": 9.8 }]
}
Heatmap count
{
  "type": "heatmap",
  "x": "hour",
  "y": "traffic",
  "aggregate": "count",
  "data": [{ "hour": "09", "traffic": "high" }]
}
Treemap drill
{
  "type": "treemap",
  "path": ["region", "state", "product"],
  "y": "revenue",
  "drill": true,
  "data": [{ "region": "West", "state": "CA", "product": "A", "revenue": 5000 }]
}
KPI with monthly delta and sparkline
{
  "type": "kpi",
  "x": "month",
  "y": "sales",
  "format": "currency",
  "data": [
    { "month": "Mar", "sales": 45000 },
    { "month": "Apr", "sales": 50700 },
    { "month": "May", "sales": 54500 }
  ]
}
Dumbbell horizontal
{
  "type": "dumbbell",
  "x": "region",
  "y": "revenue",
  "series": "year",
  "horizontal": true,
  "format": "currency",
  "data": [
    { "region": "North", "year": "2024", "revenue": 45000 },
    { "region": "North", "year": "2025", "revenue": 52000 }
  ]
}
Bar with dual axis (line overlay)
{
  "type": "bar",
  "x": "month",
  "y": "revenue",
  "y2": "customers",
  "format": { "revenue": "currency", "customers": "integer" },
  "data": [
    { "month": "Jan", "revenue": 10500, "customers": 120 },
    { "month": "Feb", "revenue": 12000, "customers": 145 }
  ]
}
Ridgeline
{
  "type": "ridgeline",
  "x": "year",
  "y": "value",
  "series": "product",
  "data": [
    { "year": 2020, "product": "A", "value": 100 },
    { "year": 2021, "product": "A", "value": 120 }
  ]
}
Beeswarm
{
  "type": "beeswarm",
  "y": "value",
  "series": "category",
  "name": "id",
  "data": [
    { "id": "1", "category": "A", "value": 15 },
    { "id": "2", "category": "A", "value": 18 }
  ]
}
Parallel coordinates
{
  "type": "parallel",
  "x": "item",
  "y": ["revenue", "units", "margin"],
  "series": "region",
  "data": [
    { "item": "1", "region": "North", "revenue": 1000, "units": 50, "margin": 0.25 },
    { "item": "2", "region": "South", "revenue": 1200, "units": 60, "margin": 0.22 }
  ]
}
Table
{
  "type": "table",
  "x": "product",
  "y": ["revenue", "units"],
  "sort": "desc",
  "format": { "revenue": "currency", "units": "integer" },
  "data": [
    { "product": "A", "revenue": 5000, "units": 100 },
    { "product": "B", "revenue": 3500, "units": 75 }
  ]
}
Radial
{
  "type": "radial",
  "x": "month",
  "y": "value",
  "series": "product",
  "data": [
    { "month": "Jan", "product": "A", "value": 10 },
    { "month": "Feb", "product": "A", "value": 15 }
  ]
}
Chord diagram
{
  "type": "chord",
  "path": ["from", "to"],
  "y": "flow",
  "data": [
    { "from": "A", "to": "B", "flow": 100 },
    { "from": "B", "to": "C", "flow": 75 }
  ]
}
Marimekko (treemap grid)
{
  "type": "marimekko",
  "x": "category",
  "y": "value",
  "series": "segment",
  "data": [
    { "category": "A", "segment": "X", "value": 50 },
    { "category": "A", "segment": "Y", "value": 30 }
  ]
}
Waffle
{
  "type": "waffle",
  "x": "category",
  "y": "value",
  "data": [
    { "category": "A", "value": 45 },
    { "category": "B", "value": 30 },
    { "category": "C", "value": 25 }
  ]
}
Weave (mayacharts/weave)
{
  "type": "weave",
  "x": "year",
  "y": "sales",
  "series": "team",
  "data": [
    { "year": "2024", "team": "A", "sales": 10 },
    { "year": "2024", "team": "B", "sales": 12 },
    { "year": "2025", "team": "A", "sales": 15 },
    { "year": "2025", "team": "B", "sales": 9 }
  ]
}
Units (mayacharts/units): one dot per row; the legend toggles groups
{
  "type": "units",
  "x": "plan",
  "y": "spend",
  "name": "customer",
  "data": [
    { "customer": "c1", "plan": "Pro", "spend": 120 },
    { "customer": "c2", "plan": "Free", "spend": 0 }
  ]
}
Orbit (mayacharts/orbit): growth sets speed and direction
{
  "type": "orbit",
  "x": "product",
  "y": "revenue",
  "y2": "growth",
  "format": { "growth": "percent" },
  "data": [
    { "product": "A", "revenue": 500, "growth": 0.12 },
    { "product": "B", "revenue": 300, "growth": -0.05 }
  ]
}
Constellation (mayacharts/constellation)
{
  "type": "constellation",
  "x": "account",
  "y": ["revenue", "seats", "tickets"],
  "data": [
    { "account": "Acme", "revenue": 120, "seats": 40, "tickets": 3 },
    { "account": "Globex", "revenue": 80, "seats": 25, "tickets": 9 },
    { "account": "Initech", "revenue": 95, "seats": 30, "tickets": 4 }
  ]
}
Box plot (mayacharts/stats)
{
  "type": "boxplot",
  "x": "region",
  "y": "sales",
  "name": "store",
  "data": [
    { "region": "North", "store": "N1", "sales": 120 },
    { "region": "North", "store": "N2", "sales": 95 },
    { "region": "South", "store": "S1", "sales": 80 }
  ]
}
Funnel (mayacharts/stats, stages as fields; or x for the stage and one y)
{
  "type": "funnel",
  "y": ["visits", "signups", "paid"],
  "data": [{ "visits": 12000, "signups": 2900, "paid": 1100 }]
}
Insight list (one row per move; rows with an evidence value are its bars)
{
  "type": "list",
  "path": ["move", "evidence"],
  "y": "value",
  "body": "text",
  "rowFormat": "format",
  "bars": true,
  "data": [
    {
      "move": "Lead with Jackets",
      "text": "Earns $86.81 a unit",
      "value": 86.81,
      "format": "currency"
    },
    { "move": "Lead with Jackets", "evidence": "Vests", "value": 71.07, "format": "currency" }
  ]
}Each module extends the core with chart types and shares the same spec, theme, tooltip, a11y, and animation.
| Module | Types | Size (gzip) | Classic script |
|---|---|---|---|
mayacharts/hierarchy |
treemap, sunburst, marimekko, waffle | 4.9 KB | maya.hierarchy.global.js |
mayacharts/flow |
sankey, chord | 4.1 KB | maya.flow.global.js |
mayacharts/radial |
radial, gauge | 6.1 KB | maya.radial.global.js |
mayacharts/geo |
hexmap (50 US states + DC + PR) | 3.0 KB | maya.geo.global.js |
mayacharts/stats |
boxplot, funnel | 3.9 KB | maya.stats.global.js |
mayacharts/weave |
weave (ranks that cross over and under) | 2.6 KB | maya.weave.global.js |
mayacharts/units |
units (one dot per row: waffle, bars, swarm) | 2.5 KB | maya.units.global.js |
mayacharts/orbit |
orbit (planets sized by value, speed by growth) | 2.5 KB | maya.orbit.global.js |
mayacharts/constellation |
constellation (rows placed by similarity across measures) | 3.0 KB | maya.constellation.global.js |
The thirteen core types (bar, line, area, scatter, heatmap, waterfall, kpi, dumbbell, ridgeline, beeswarm, parallel, table, list) need no module: they ship with mayacharts and mayacharts/element, and in maya.core.global.js. A module type that is not loaded fails with unknown-type, and the message names the import and the classic script to add.
Host adapters for BI tiles are in mayacharts/host, see Embedding in hosts.
| What | Import or file |
|---|---|
render, renderShell, renderParts, validateSpec, MayaSpecError, registerTheme, version and all types; pure, no DOM |
mayacharts |
Registers <maya-chart> and the thirteen core types |
mayacharts/element |
| One of the nine modules above; importing it registers its types | mayacharts/<module> |
thoughtspot(viz, spec) and columns(table, spec) adapters |
mayacharts/host |
themes: 18 ready-made token sets as plain data, registered by name on import (maya.themes in maya.global.js) |
mayacharts/themes |
| The stylesheet as a file, for hosts that cannot run script | mayacharts/theme.css |
| JSON Schema of the spec, for editors and LLMs | mayacharts/schema.json |
Everything in one classic script; globalThis.maya.render, maya.renderShell, maya.host |
dist/maya.global.js |
Element, the thirteen core types and maya.host |
dist/maya.core.global.js |
| One per module (hierarchy, flow, radial, geo, stats, weave, units, orbit, constellation); load after the core file | dist/maya.<module>.global.js |
Every release prints an SRI hash for each dist/*.global.js file. Pin the version in the URL.
Paste this anywhere:
<script
  src="https://cdn.jsdelivr.net/npm/mayacharts/dist/maya.global.js"
  integrity="sha384-REPLACE_AT_RELEASE"
  crossorigin="anonymous"
></script>
<script>
  const chart = document.createElement("maya-chart");
  chart.spec = { type: "bar", data, x: "month", y: "revenue" };
  document.body.appendChild(chart);
</script>
The integrity value above is a placeholder: the real SRI hash of every global file is published with each release. Pin the version in the URL when you use it.
maya.global.js holds every chart type. A page that draws only core types can load maya.core.global.js (the element, the thirteen core types and maya.host) and add one classic script per module after it, such as maya.hierarchy.global.js or maya.stats.global.js. An unknown-type error names the file to add.
Or inline it in a sandbox:
<script type="text/javascript">
  // (paste the entire maya.global.js here)
</script>
The module is available as globalThis.maya.render(), maya.renderShell(), and the <maya-chart> element registers automatically.
Always on (opt out with false): tooltip, hover-dim, legend toggle, keyboard, crosshair on line/area.
Motion: the first draw plays an entrance (bars rise in a stagger, lines and flows wipe in, radial charts bloom, kpi numbers count up) and every update animates from the old state. Line and area paths morph in Chromium and Firefox and crossfade in Safari. animate: false or prefers-reduced-motion: reduce turns all of it off. Transitions in the stylesheet use the --maya-ease custom property.
Opt-in: drill, select, zoom. Two-way: el.view, el.selected.
Drill and select together: a click or Enter selects (to cross-filter a dashboard), a double-click or Shift+Enter drills, and a pinned tooltip offers a "Drill into" button for touch. At the deepest level the drill gesture fires maya-drill-leaf with the full path, for a host drill-through. A sankey drill starts from the first column, then continues one column at a time through any non-final node: the clicked node stays as the first column with its downstream flows. A chord drills into one group's flows; with three path levels it splits the clicked target into its children while the sources stay. With seriesPath the gesture splits the mark's series instead of its category, and a line with drillTo opens a sub-chart for the series. A heatmap with xPath drills its columns from a column header, with a second breadcrumb. A drilled waterfall step opens and closes at the running totals around it; a drilled hexmap state draws its children as bars.
| Key | Action |
|---|---|
| Tab | Move focus between the chart, legend buttons, measure toggle, breadcrumb and Reset chip |
| Arrow Left/Right | Previous/next category (same series); on the measure toggle, previous/next measure |
| Arrow Up/Down | Previous/next series in the same category; on the measure toggle, previous/next measure |
| Home / End | First/last measure (measure toggle) |
| Shift+Enter | With drill and select both on: drill into the focused mark |
| Enter | Drill into the focused mark, else select it (with drill and select both on: select) |
| Space | Pin or unpin the tooltip on the focused mark |
| Enter / Space | On a focused table header: sort by that column |
| Escape | First of: unpin tooltip, cancel brush in progress, clear selection, reset zoom window, pop one drill level |
+ or = / - |
With zoom: halve the window about the active mark (else the middle) / double it, reset at the full range. Ctrl, Meta and Alt combinations are left to the browser |
Touch: show tooltip on pointerup if moved < 4 px.
Six events, all bubbles: true, composed: true and none carrying the spec:
maya-select {selected: Sel[], target: (Sel & {value}) | null}- mark selectedmaya-view {measure, drill, window, hidden, form, stack, face, sortBy, brush, peers, xDrill, expanded, page, filter, frame, facetScale, params}- measure toggled, drilled, zoomed, a legend series hidden, a units form or stack mode picked, a kpi card turned over, a parallel axis brushed, beeswarm peers selected, heatmap columns drilled, a table row or list move opened, more table rows shown or the table filtered, a frame picked from a slider, tabs or select, a facet scale switched, a param slider moved or reset (user actions only;paramsis{id: value};windowis the zoom slice;brushis[field, lo, hi]per axis)maya-drill-leaf {path}- the drill gesture on a mark at the last level (one raw value perpathlevel, root first), so a host can drill through to the rows behind it. Sankey and chord fire it once drilled to their last branch. A heatmap column at its lastxPathlevel fires it withaxis: "x"and thexPathvaluesmaya-error {code, path, message}- spec error (cancelable; preventDefault() hides error box)maya-render {}- after each paint; entrance and update animations may still be runningmaya-settled {error}- after the last animation of that paint (in the same task when nothing animates), and aftermaya-errorwith the error. Tell a host the chart is ready on this one
Properties: el.view and el.selected (getters and setters; no events on set). await el.settled waits for the current or next paint to settle and rejects with the MayaSpecError on an error.
| Member | Kind | Meaning |
|---|---|---|
spec |
attribute, property | The chart spec. The attribute is JSON text and the only observed attribute; the property wins once set |
data |
property | Assigning rows replaces spec.data and animates the update |
view |
property | { measure, drill, window, hidden, form, stack, face, sortBy, frame, brush, peers, xDrill, expanded, page, filter }; set {} to reset; no events on set |
selected |
property | Sel[] of raw values; no events on set |
settled |
property (promise) | Resolves when the current or next paint has finished animating; rejects with the MayaSpecError |
toSVG() |
method | A standalone SVG string with the custom properties resolved, so a dark chart exports dark |
MayaChart.version |
static | The library version |
--maya-* |
CSS custom property | Every theme token, in kebab case (see Theme tokens), plus --maya-ease for transitions |
.maya-title, .maya-sub, .maya-legend, .maya-crumbs, .maya-ctl, .maya-reset, .maya-box, .maya-svg, .maya-tip, .maya-err, .maya-play, .maya-flip |
shadow classes | Stable hooks inside the shadow root for tests and hosts; style the chart through the custom properties |
Gestures: hover or tap shows the tooltip. With drill alone, click or Enter drills. With select alone, click or Enter selects. With both, a click selects (committed after about 250 ms, so a double-click can cancel it) and a double-click or Shift+Enter drills; the pinned tooltip has a "Drill into" button, which is not shown at the deepest level. Space pins the tooltip, Escape steps back, drag brushes a zoom window with zoom, and a legend click hides a series. The full key list is under Keyboard.
Example: selecting in one chart drives another:
chart1.addEventListener("maya-select", (e) => {
  if (e.detail.target) {
    chart2.selected = [e.detail.target];
  }
});const svg = el.toSVG(); // standalone SVG with CSS custom properties resolvedPNG via canvas:
const svg = el.toSVG();
const img = new Image();
img.onload = () => {
  const canvas = document.createElement("canvas");
  canvas.width = 640;
  canvas.height = 320;
  canvas.getContext("2d").drawImage(img, 0, 0);
  canvas.toBlob((blob) => saveAs(blob, "chart.png"));
};
img.src = "data:image/svg+xml;charset=utf-8," + encodeURIComponent(svg);React 19
import "mayacharts/element";
export const Chart = (props) => (
  <maya-chart onmaya-select={(e) => console.log(e.detail)} {...props} />
);
React 18
import { useRef } from "react";
import "mayacharts/element";
export const Chart = ({ spec }) => {
  const ref = useRef(null);
  return <maya-chart ref={ref} spec={JSON.stringify(spec)} />;
};
Vue
<script setup>
// vite.config: vue({ template: { compilerOptions: { isCustomElement: (t) => t === "maya-chart" } } })
import { ref } from "vue";
import "mayacharts/element";
const spec = ref({ type: "bar", ... });
</script>
<template>
  <maya-chart :spec.prop="spec" @maya-select="handle" />
</template>
Svelte 5
<script>
  import "mayacharts/element";
  let spec = { type: "bar", ... };
</script>
<maya-chart {spec} onmaya-select={(e) => console.log(e.detail)} />
Angular
import { CUSTOM_ELEMENTS_SCHEMA, Component } from "@angular/core";
@Component({
  selector: "app-chart",
  template: `<maya-chart [spec]="spec" (maya-select)="handle($event)"></maya-chart>`,
  schemas: [CUSTOM_ELEMENTS_SCHEMA],
})
export class ChartComponent { ... }
Plain HTML
<maya-chart id="chart" style="height: 300px"></maya-chart>
<script type="module">
  const chart = document.getElementById("chart");
  chart.spec = { type: "bar", ... };
</script>
Node SSR
import { renderShell } from "mayacharts";
const html = renderShell(spec, { width: 640, height: 320 });
res.send(html);A host that snapshots charts (PDF export, scheduled screenshots, a render-complete hook) should wait for maya-settled or await el.settled, not maya-render, or set animate: false.
Host adapters turn a columnar result into rows, unwrap { value() } cells, match fields written as the exact column name or a RegExp (case-insensitive) against the columns, find or create #chart, set the spec and return the element. They live in mayacharts/host and in the global builds as maya.host. thoughtspot tells ThoughtSpot the chart is done when it first draws, without waiting for the entrance animation, so a slow first load does not run past ThoughtSpot's wait.
// ThoughtSpot custom chart (three-file pattern):
// chart.html: <script src="https://cdn.jsdelivr.net/npm/mayacharts/dist/maya.global.js"></script>
//             <maya-chart id="chart"></maya-chart>
// chart.css:  #chart { --maya-accent: ...; --maya-series-2: ...; }
//             (theme tokens go on #chart itself; on :root, html or body they never reach the chart)
// chart.js:   const draw = () => maya.host.thoughtspot(viz, { type: "bar", x: "item", y: "sales" });
//             const go = () => window.maya && (document.removeEventListener("load", go, true), draw());
//             go() || document.addEventListener("load", go, true);

// Any host that returns { schema, data: [[...]] }
maya.host.columns(
  { schema: ["Item", "Sales"], data: [["Shirts", 10]] },
  { type: "bar", x: "item", y: "sales" },
);Everything is set in the spec, so it works the same in HTML, every framework, server rendering and the builder. The full guide has an example for each item.
| To change | Use |
|---|---|
| Heading, axis titles, legend and tooltip names | title, subtitle (both take data tokens such as {max.x}), titles (by field) |
| Title and axis text size, title weight | theme.titleSize, theme.titleWeight, theme.axisSize |
| Legend position | legend: "top", "bottom" or "right" |
| Reference lines, bands, notes | rules (value, { x }, { band }, { slope }), annotate ("max"... or { x, text }) |
| Values on marks, line end names | labels, endLabels |
| Number and date display | format (presets, templates, Intl options), locale, currency |
| Built-in words such as No data, Back, Other | text |
| Typeface and text size | theme.font, theme.fontSize |
| Text colours | theme.fg, theme.fgMuted, theme.tooltipBg, theme.tooltipFg |
| Series colours | colors (array, or map by series, path[0] value or node name), theme.accent, theme.series1 to series8, or a ready-made theme |
| Good and bad tones, ramps | colorBy with theme.good, theme.bad |
| Grid, axes, legend, tooltip | grid, theme.grid, theme.gridDash, xAxis, yAxis, legend, tooltip |
| Bar corners, line width | theme.radius, theme.line |
| Height, light or dark | CSS on the element: height, color-scheme |
Not customisable: line width and opacity per series (dash names dashed series), and styling of single marks.
Height: a chart takes the height its container gives it. Only with no definite height does it keep a floor, so it never spills out of a short box such as a BI tile. Under about 160 px of plot it draws a compact frame (no axis titles, fewer ticks), and in an element under 200 px tall the title is one line with an ellipsis (the full text shows on hover) and the subtitle is hidden.
Every colour and font is a CSS custom property. Set them on the maya-chart element itself, by tag, class or id. A value on :root, html, body or another ancestor does nothing: the chart sets its own defaults on the element, and those beat anything it would inherit. spec.theme beats the CSS. In CSS, numeric is written as its font value (--maya-numeric: tabular-nums). axisSize, labelSize, heroSize and cellGap also size the layout, and rampMid makes a ramp diverging, so set those in spec.theme.
maya-chart {
  --maya-accent: oklch(0.65 0.2 145);
  --maya-font: "Inter", sans-serif;
  --maya-series-1: #2563eb;
}| Token | CSS variable | Light default | Dark default | Colours |
|---|---|---|---|---|
| font | --maya-font | system-ui, sans-serif | same as light | Axis labels, tooltip text |
| fontSize | --maya-font-size | 12px | 12px | All text |
| fg | --maya-fg | #1f2328 | #e6edf3 | Title, value labels |
| fgMuted | --maya-fg-muted | #656d76 | #9198a1 | Axis text, legend, breadcrumb |
| grid | --maya-grid | fg at 10% (color-mix) | fg at 10% (color-mix) | Grid lines |
| bg | --maya-bg | #fff | #0d1117 | Background, tooltip text |
| accent | --maya-accent | oklch(.6 .17 255) | oklch(.6 .17 255) | Focus outline, series 1 |
| radius | --maya-radius | 3px | 3px | Mark border radius |
| tooltipBg | --maya-tooltip-bg | --maya-bg at 92% (color-mix) | same as light | Tooltip card background |
| tooltipFg | --maya-tooltip-fg | --maya-fg | --maya-fg | Tooltip text |
| focus | --maya-focus | --maya-accent | --maya-accent | Keyboard focus ring |
| good | --maya-good | #1a7f37 | #3fb950 | colorBy positive / above target |
| warn | --maya-warn | #996600 | #ffcc33 | colorBy at risk (warn band) |
| bad | --maya-bad | #cf222e | #f85149 | colorBy negative / below target |
| series1-8 | --maya-series-1 to --maya-series-8 | 1: --maya-accent; 2-8: oklch presets | same as light | Series colours (max 8) |
| line | --maya-line | 2.25 | 2.25 | Line width |
| gridDash | --maya-grid-dash | none | none | Grid dash array, e.g. 2 4 |
| titleSize | --maya-title-size | 15px | 15px | Title text size |
| titleWeight | --maya-title-weight | 600 | 600 | Title weight |
| axisSize | --maya-axis-size | 11px | 11px | Axis tick label size |
| subtitleSize | --maya-subtitle-size | fontSize | fontSize | Subtitle text size |
| labelSize | --maya-label-size | 11px | 11px | Value labels and annotations |
| legendSize | --maya-legend-size | fontSize | fontSize | Legend text size |
| heroSize | --maya-hero-size | fitted to the tile | fitted to the tile | The kpi and gauge number; a px value caps the fitted size |
| heroWeight | --maya-hero-weight | 600 | 600 | The kpi and gauge number weight |
| emptySize | --maya-empty-size | fontSize | fontSize | The no-data text |
| numeric | --maya-numeric | tabular | tabular | "tabular" or "proportional" figures |
| rampLow | --maya-ramp-low | accent mixed into bg | same as light | Low end of the value ramp (heatmap, hexmap, calendar) |
| rampHigh | --maya-ramp-high | accent toward fg | same as light | High end of the value ramp |
| rampMid | --maya-ramp-mid | none | none | Centre of a diverging ramp (set it to diverge) |
| rampMidValue | --maya-ramp-mid-value | 0 | 0 | The value at rampMid (a number) |
| up | --maya-up | good | good | Increases: waterfall steps, colorBy "sign", dumbbell connectors |
| down | --maya-down | bad | bad | Decreases |
| total | --maya-total | fgMuted | fgMuted | Waterfall totals |
| neutral | --maya-neutral | fgMuted | fgMuted | Other, unmapped names, folded slices |
| cellGap | --maya-cell-gap | 2px (1px under 12 px cells) | same as light | Gap between heatmap and waffle cells (px) |
| cellRadius | --maya-cell-radius | radius | radius | Heatmap and waffle cell corners |
| labelInk | --maya-label-ink | fg | fg | Labels on light fills |
| labelInkOnFill | --maya-label-ink-on-fill | bg | bg | Labels on dark fills |
| lineEmphasis | --maya-line-emphasis | line x 1.75 | line x 1.75 | Stroke width of emphasis series |
| ghost | --maya-ghost | fg | fg | was ghosts |
A colour comes from, first match wins: a colors map key, a colorBy tone, the theme's series1 to series8, a colors array, then accent. A value ramp (a colorBy field, heatmap, hexmap) uses the ramp tokens and ignores the map.
mayacharts/themes has 18 token sets for spec.theme. Each sets the eight series colours plus corner radius, line width and grid style. Colours are light-dark(light, dark) and follow the page's color-scheme. Every order keeps neighbouring series apart for colourblind readers (adjacent protan and deutan separation of 8 or more, normal vision 15 or more, in light and dark).
| Theme | Look |
|---|---|
| classic | The familiar BI-tool palette people already know |
| corporate | Trustworthy blues with clear accents, boardroom safe |
| bright | Clean saturated primaries, the modern SaaS look |
| ocean | Deep blues and teals with a coral spark |
| arctic | Icy blues against magenta and violet, cool and crisp |
| royal | Navy, gold, crimson and emerald, formal and rich |
| berry | Raspberry, plum and violet, rich and moody |
| sunset | Hot reds, oranges and purples, warm and bold |
| retro | 70s mustard, rust and teal |
| earth | Clay, sage and olive, editorial and muted-warm |
| spring | Fresh greens, pinks and sky blue, light and happy |
| mint | Emerald and indigo with warm pops, modern app |
| lagoon | Aqua, pink and emerald, summery |
| candy | Bright pastels, playful and friendly |
| aurora | Violet, teal and pink, rounder and airier |
| pop | Hot pink, electric blue and sunflower, maximum energy |
| neon | Electric on dark pages, punchy on light |
| synthwave | Purple, hot pink and cyan, 80s neon nights |
import "mayacharts/themes"; // registers the 18 names
chart.spec = { ...spec, theme: "ocean" };
// Change one token: theme: ["pop", { radius: "0px" }]
// The data itself: import { themes } from "mayacharts/themes"; theme: { ...themes.pop, radius: "0px" }
maya.global.js registers them too and has them as maya.themes. A host defines its house theme once with registerTheme("house", { font: "Geist, sans-serif", accent: "#1E1E24" }) (maya.registerTheme without a bundler) and every spec says theme: "house". An unknown name throws invalid-theme listing the registered ones. A theme.accent also recolours series 1 unless colors or theme.series1 sets it.
Brand palette example:
maya-chart {
  --maya-accent: #7c3aed;
  --maya-series-1: #7c3aed;
  --maya-series-2: #ec4899;
  --maya-series-3: #f59e0b;
  --maya-good: #10b981;
  --maya-bad: #ef4444;
}
The chart follows the page's color-scheme. A page without one gets a light chart; a page that sets color-scheme: light dark (or <meta name="color-scheme" content="light dark">) gets a chart that tracks the OS. Set color-scheme on maya-chart itself to pin one chart. Override colours per scheme with prefers-color-scheme:
@media (prefers-color-scheme: dark) {
  maya-chart {
    --maya-accent: #60a5fa;
  }
}
High contrast systems (forced-colors: active) are supported; outline tones instead of colour.
The chart spec is plain JSON generated by end users or LLMs, not trusted code. mayaCharts escapes all text, allowlists CSS values, and works inside Trusted Types policies.
- All text is HTML-escaped before rendering
- CSS values for colors and theme are allowlisted (blocks url(), expression() and injection syntax)
renderShell()embeds only the spec fields actively used (data minimisation)- A11y table shows encoded fields only, capped at 1000 rows
- No inline styles: Dynamic styles use CSSOM
setProperty()or CSS custom properties - No network requests or telemetry
- Compatible with Trusted Types policy
"mayacharts"(calltrustedTypes.createPolicy("mayacharts", {createHTML: s => s})) - Supports CSP
trusted-types mayachartsandnonceon the shell style tag
See SECURITY.md for the full security model.
Fully conformant with WCAG 2.2 AA, verified by axe-core on every gallery tile in both light and dark modes.
Implemented: semantic role and title, accessible description, data table for screen readers, keyboard navigation (Tab, arrows, Enter, Space, Escape), live region updates, focus management, forced-colors support, reduced motion support, ≥3:1 contrast in both light and dark modes, non-colour cues (text tone), 12 px touch target enlargement.
Known ceilings: left labels are cut at 40% width and bottom category labels at their slot width; UTC dates unless Intl options say otherwise; scatter keyboard order follows draw order (not spatial); stacked bar labels show segments, not totals.
See STABILITY.md for the full accessibility and performance envelope.
Upper bounds asserted by test/perf.test.ts for render() in Node (test thresholds, not measured timings; output is uncompressed SVG string length):
| Scenario | Marks | Render time threshold | Output threshold |
|---|---|---|---|
| 5k-category bar | 5000 | < 400 ms | < 2.2 MB |
| 10k-category bar | 10000 | < 1500 ms | < 4.4 MB |
| 5k-point scatter | 5000 | < 200 ms | - |
| Heatmap 50x52 | 2600 | < 100 ms | - |
20k-row bar, limit: 20 |
21 | < 400 ms | < 200 KB |
Animation skips above 1500 marks. The 10000-mark hard cap names the count and the row count and suggests limit or aggregate; bars, lines, kpi, scatter and tables reduce instead. The data table is capped at 1000 rows. One million rows (bar of 1M categories, line over 1M categories, 1M-row table, kpi) render in under 10 s on CI hardware and under 2 s when the same array is drawn again; the test is in test/perf.test.ts.
Every error is a MayaSpecError with {code, path, message}, and the message links to errors.html with a one-paragraph cause and a fixed example. The maya-error event carries the same three fields.
| Code | Cause |
|---|---|
spec-not-object |
spec must be a plain object |
missing-field |
type/data/x (or path)/y is required but missing |
unknown-type |
chart type not recognized (with module hint if needed: the ESM import and the maya..global.js file) |
data-not-array |
data must be an array of row objects |
row-not-object |
data[i] must be a plain object |
unknown-field |
field-valued option names no field in data |
non-numeric-y |
y field value not a finite number (null allowed) |
non-numeric-field |
size/scatter x/colorBy field value not a finite number |
non-positive-value |
treemap/sunburst/sankey/chord y value must be positive; funnel and ridgeline y value must not be negative; a value on a log axis (yScale/xScale "log") must be above 0 |
unknown-option |
top-level spec key not recognized |
invalid-option |
option value wrong type or invalid value |
option-unsupported |
option not valid for this chart type or incompatible with another option |
stack-unsupported |
stack (true or "percent") not allowed with type "line" (use "area" instead) |
invalid-domain |
xDomain not [min, max] with min < max; yDomain not two different numbers (reversed allowed); bounds within 1e300, span at least 1e-300 |
invalid-format |
format preset unknown, bad Intl options, or unsupported locale/currency |
invalid-theme |
theme token not recognized |
unsafe-css-value |
colors/theme CSS value blocked by allowlist (no url(), other functions, ; { } < > ) |
invalid-size |
RenderOptions width/height not a finite number > 0 |
unknown-state |
hexmap x value is not a US state (two-letter code or full name; 50 states, DC, PR) |
too-many-marks |
more than 10000 marks (the message gives the count, the cap and the row count; suggest limit or aggregate). Bars roll up, categorical lines and kpi thin, scatter bins and tables draw the rows that fit instead of failing. |
invalid-date |
xType "time" with an x value that is neither an ISO 8601 date nor epoch ms |
too-few-measures |
constellation y is not an array of at least 2 measures |
Every cap and approximation is written down with its reason in NON-FEATURES.md. The ones most likely to matter: 10000 marks (bars roll up, other types reduce or throw too-many-marks), 8 series colours, 4 rules, 12 tooltip rows, 1500 dots for units, UTC dates unless Intl options say otherwise, and no function-valued options.
npm install
npm test          # unit, property, fuzz, hostile-string, perf, leak tests
npm run build     # dist/
npm run size      # check budgets
npm run e2e       # Playwright
npm run dev       # demo site at localhost:5173
npm run tokens    # Claude token spend on this repo
git config core.hooksPath "$PWD/.githooks" # refresh the token count below on each commitTokens spent with Claude Code since the first commit, across 21,258 API calls. Most are cached context re-read on each turn. Updated on every commit by npm run tokens -- --readme.
- claude-opus-5-5: 2,002,898,816 total, 3,635,847 output
- claude-sonnet-5-5: 982,632,186 total, 156,500 output
- claude-fable-5-1: 189,095,384 total, 391,915 output
- claude-haiku-4-5-20251001: 36,667,024 total, 10,548 output
- claude-sonnet-5: 7,674,739 total, 43,301 output
- claude-haiku-5-5: 1,341,167 total, 903 output
- claude-opus-5: 123,120 total, 12 output
- all: 3,220,432,436 total, 4,239,026 output
mayaCharts is free and MIT, built by one person with the Claude tokens counted above. If it saves you time, a one-off tip helps pay for the next release.
You pick the amount. Tips buy no features or priority, and nothing in the library will ever sit behind a paywall.
mayaCharts follows semantic versioning. Public API: spec keys and semantics, schema.json, error code/path, element properties/methods, event detail shapes, CSS custom property tokens, data-_ attribute roles and values, .maya-_ class names. See STABILITY.md for the full stability policy and pre-1.0 deprecation path via HINTS.
MIT, and the core library will stay MIT. Any paid offerings will be things outside the core, such as support contracts, hosted services and separate add-ons. Nothing in the library will move behind a paywall. See LICENSE.