Repository navigation
Lollipop chart #417
Description

Description
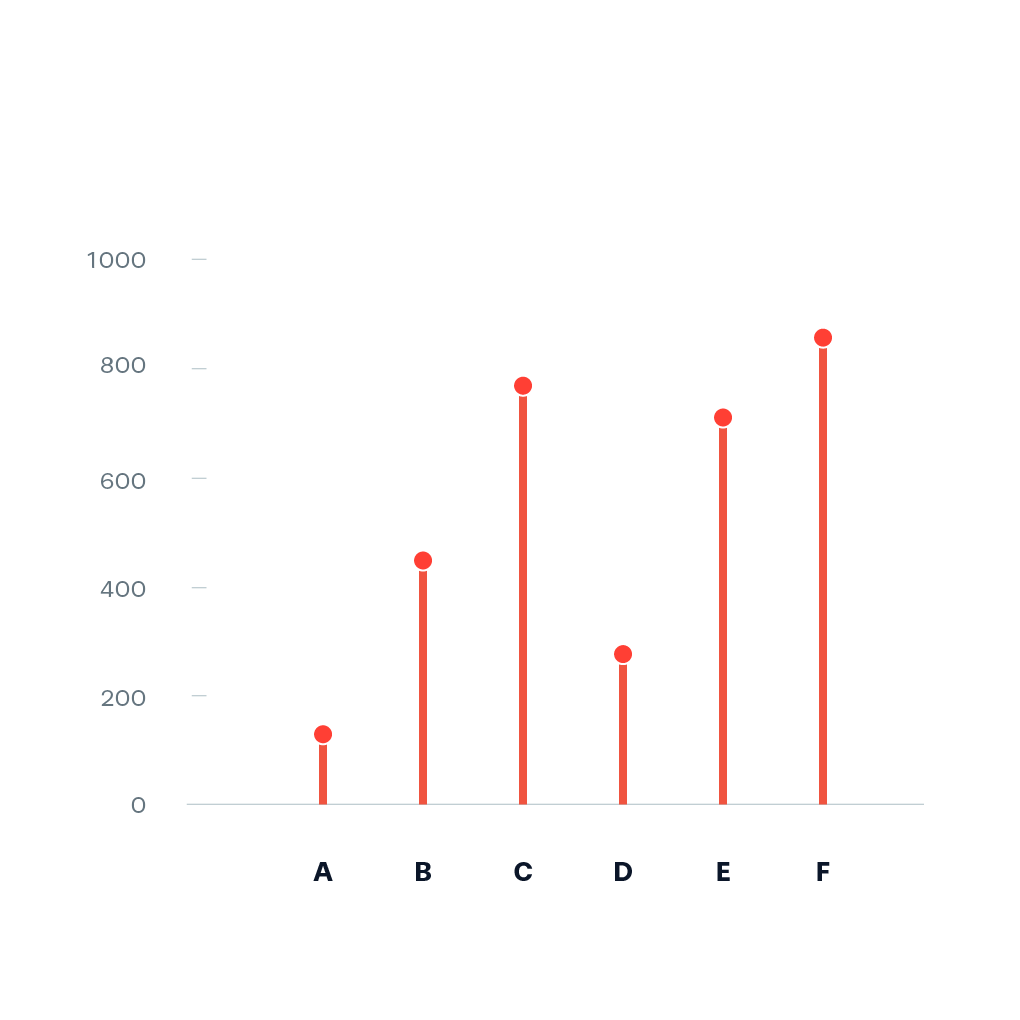
A Lollipop chart is a categorical chart that is basically a bar chart replaced by points being connected by a line to the zero-line of the reference axis representing the data. It can be helpful to reduce visual noise when all values have a similar height [1].
Example:
Pointers
- Ideally, you start prototyping in a scripting or notebook environment where you can iterate fast. installation instructions can be found here: https://plotly.net/#Installation
- Charts like this that are using baseline trace types to create a new chart type should only be implemented in the top-level Chart API. An example where this is already done is the Range chart that combines a set of differently styled line charts.
- When possible, use
#IConvertiblefor data input, as this allows forstrings, number types such asintandfloat, andDateTime.
References
Hints (click to expand if you need additional pointers)
- The most suitable base chart for this is a set of line charts that each connect the zero line to a data point
- The high-level function should look quite similar to the base implementation of
Chart.Bar
Activity
Ben757 commentedon Sep 30, 2023
Working on it
#FsLabHackathon2023
kMutagene commentedon Oct 16, 2023
Hey @Ben757. Are you still planning to finish this? If not, I would greatly appreciate if you could link what you ended up with during the hackathon (e.g. a script or notebook you worked in) so others can use it as a foundation to tackle this chart. If also do not have anything to link, no worries, please just tell me that this issue is up-for-grabs again. Thanks ❤️
kMutagene commentedon Feb 5, 2024
I hope it is okay to assume that i can move this into the v5 milestone and start working on it, if that is not the case, please leave a message
kMutagene commentedon May 8, 2024
Here, basically the same applies as in #418. The line should be implemented as a shape, as the points should be a single trace. This needs the shape.layer.between attribute, which needs plotly.js 2.31, which will not be supported in v5.